3

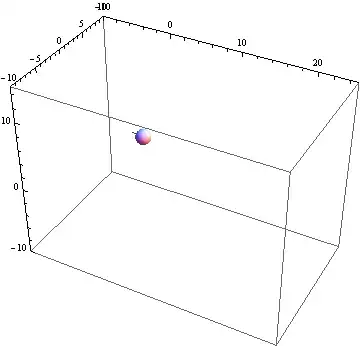
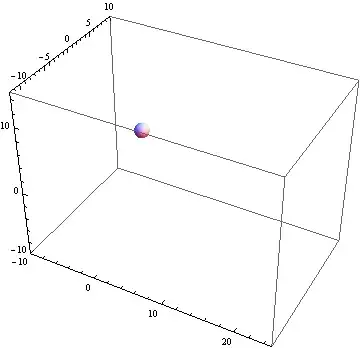
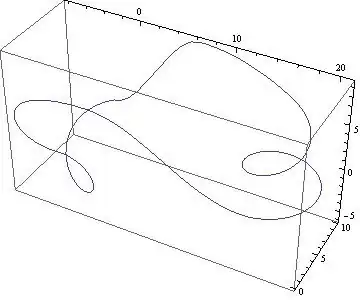
I have a 3D plot. I need to add a small sphere marking the starting point, r[t] == 0. I'm pretty new at Mathematica and would greatly appreciate some help.

r[t_] = 
  Piecewise[{
    {{5 t, 0, 3 (1 + Cos[ t])}, 0 <= t <= π}, 
    {{5 Cos[t - 3 π/2] + 5*π, 5 Sin[t - 3 π/2] + 5, 0}, π < t <= 2 π}, 
    {{5*π + 3*Cos[t - 3 π/2], 2*5 - 3 + 3*Sin[t - 3 π/2], 1/(2 π) (t - 2 π)^2}, 
      2 π < t <= 4 π}, 
    {{-3 (t - 17 π/3), 10, -1/π t^2 + 10 t - 22 π}, 4 π < t <= 5 π}, 
    {{-3 t + 17 π, 10, -972 π + 540 t - (99 t^2)/π + (6 t^3)/π^2}, 5 π < t <= 6 π}, 
    {{-π - 3 Sin[t], 9/40 (1/3 (20 + 18 π) - t)^2, 3 Cos[t] - 3}, 6 π < t <= 8 π}, 
    {{-25 π + 25 t - (19 t^2)/(4 π) + t^3/(4 π^2), 
      -(25/2) (140 - 132 π + 27 π^2) + (15 (80 - 74 π + 15 π^2) t)/(2 π) - 
         (3 (180 - 164 π + 33 π^2) t^2)/(8 π^2) - 
         ((-50 + 45 π - 9 π^2) t^3)/(20 π^3), 
      1056 - (360 t)/π + (81 t^2)/(2 π^2) - (3 t^3)/(2 π^3)}, 
      8 π < t <= 10 π}}];

s[t_] = Cos[t]

ParametricPlot3D[r[t], {t, 0, 10 π}]
m_goldberg
  • 107,779
  • 16
  • 103
  • 257
goldiefish
  • 47
  • 2

3 Answers3

13

Just for fun:

Animate[Show[
  ParametricPlot3D[r[t], {t, 0, u}, PlotRange -> {{-10, 25}, {-10, 10}, {-10, 15}}], 
  Graphics3D@Sphere[r[u], 1]], 
{u, 0, 10 Pi}]

enter image description here

I'm bored:

Animate[Show[
  ParametricPlot3D[r[t], {t, 1/100, u}, PlotRange -> {{-10, 25}, {-12, 10}, {-10, 15}}], 
  Graphics3D[Table[{Opacity[1 - h/u], Sphere[r[u - h], 1]}, {h, 0, u - .1, u/10}]]], {u, 0.1, 10 Pi, .1},
 DisplayAllSteps -> True]

enter image description here

And a last one laying ephemeral eggs:

Animate[Show[
  ParametricPlot3D[r[t], {t, 1/100, u}, PlotRange -> {{-10, 25}, {-12, 10}, {-10, 15}}], 
  Graphics3D[{Sphere[r[u], 1], Table[{Opacity[h^4/u^4], Sphere[r[h], 1]}, {h, 0, u, 1}]}]], 
{u, 0.1, 10 Pi, .1}, DisplayAllSteps -> True]

enter image description here

Dr. belisarius
  • 115,881
  • 13
  • 203
  • 453
3

You can combine graphics via Show

Show[{ParametricPlot3D[r[t], {t, 0, 10 Pi}],
 Graphics3D[{Red, Sphere[{0, 0, 0}, 2]}]}]
c186282
  • 1,402
  • 9
  • 17
2

There is syntax issue with your expression. Pi should not be in [].

r[t_] := Piecewise[{{{5 t, 0, 3 (1 + Cos[t])}, 
0 <= t <= Pi}, {{5 Cos[t - 3 Pi/2] + 5*Pi, 5 Sin[t - 3 Pi/2] + 5, 
 0}, Pi < t <= 2 Pi}, {{5*Pi + 3*Cos[t - 3 Pi/2], 
 2*5 - 3 + 3*Sin[t - 3 Pi/2], 1/(2 Pi) (t - 2 Pi)^2}, 
2 Pi < t <= 4 Pi}, {{-3 (t - 17 Pi/3), 
 10, -1/Pi t^2 + 10 t - 22 Pi}, 
4 Pi < t <= 5 Pi}, {{-3 t + 17 Pi, 
 10, -972 Pi + 540 t - (99 t^2)/Pi + (6 t^3)/Pi^2}, 
5 Pi < t <= 6 Pi}, {{-Pi - 3 Sin[t], 
 9/40 (1/3 (20 + 18 Pi) - t)^2, 3 Cos[t] - 3}, 
6 Pi < t <= 
 8 Pi}, {{-25 Pi + 25 t - (19 t^2)/(4 Pi) + 
  t^3/(4 Pi^2), -(25/2) (140 - 132 Pi + 
     27 Pi^2) + (15 (80 - 74 Pi + 15 Pi^2) t)/(2 Pi) - (3 (180 - 
       164 Pi + 33 Pi^2) t^2)/(8 Pi^2) - ((-50 + 45 Pi - 
       9 Pi^2) t^3)/(20 Pi^3), 
 1056 - (360 t)/Pi + (81 t^2)/(2 Pi^2) - (3 t^3)/(2 Pi^3)}, 
8 Pi < t <= 10 Pi}}]; s[t_] := Cos[t]

For 3D plot

ParametricPlot3D[{r[t], s[t]}, {t, 0, 10 Pi}]

enter image description here

For sphere as mentioned by @c186282 use this

Show[{ParametricPlot3D[r[t], {t, 0, 10 Pi}], Graphics3D[{Red, Sphere[{0, 0, 0}, 2]}]},PlotRange -> All]

enter image description here

zhk
  • 11,939
  • 1
  • 22
  • 38