Is there any simple way to increase or decrease the decimal places in the frame ticks. I want to make the y axis ticks of the first two and the second two graphs look similar.

Is there any simple way to increase or decrease the decimal places in the frame ticks. I want to make the y axis ticks of the first two and the second two graphs look similar.
I'd like to present another approach I like to use, when it comes to styling ticks:
Define a tickFormat function
We define a function that formats the ticks we want to use (so that we don't have to specify them manually, later on).
tickFormat[xmin_, xmax_, digits_, divisions_: 10] :=
    Function[tickNumber, {tickNumber,
       PaddedForm[Round[tickNumber, 0.01],
         {Max@(Length@IntegerDigits@IntegerPart[#] & /@
         (10^digits {xmin, xmax})), digits}]
     }] /@ FindDivisions[{xmin, xmax}, divisions];
I am sure you'll easily see how it works and how you could possibly customize this account.
Note: I introduced 2 auxiliary variables to tickFormat, i.e. the 3rd variable controls the number of digits after the decimal separator to be displayed and the 4th (optional) argument specifies the number of ticks FindDivisions will insert (note: this can slightly vary, see documentation of FindDivisions)
Application
All "frame-axes"
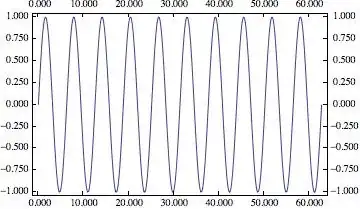
Plot[Sin[x], {x, 0, 20 \[Pi]}, Axes -> False, Frame -> True,
    FrameTicks -> (tickFormat[#1, #2, 3, 10] &)]
y-Axis only
Plot[Sin[x], {x, 0, 20 \[Pi]}, Axes -> False, Frame -> True,
     FrameTicks -> {Automatic, (tickFormat[#1, #2, 5, 12] &), None, None}]

Note
This works on normal axes just as shown for "FrameAxes"
Here is the code I use to style ticks, including a DecimalPadding option that uses the in-built NumberForm functionality to generate the desired look.
Options[myTickGrid] = {UnitLabelShift -> 1.4, DecimalPadding -> 0};

myTickGrid[min_?NumericQ, max_?NumericQ, seg_, units_, len_: 0,
  opts : OptionsPattern[{myTickGrid, NumberForm}]] :=
 With[{dec = OptionValue[DecimalPadding]},
  Table[{i, If[i == max, makeUnitLabel[units,
      Sequence @@ FilterRules[{opts}, Options[myTickGrid]]],
     mynumberformat[i, dec,
      Sequence @@ FilterRules[{opts}, Options[NumberForm]]]], {len, 0}},
    {i, If[Head[seg] === List, Union[{min, max}, seg],
     Range[min, max, seg]]}]]

unitlab2 =
  2.2;(*the amount of additional downshift needed to align the top of \
the unit label to the top of the plot area when the unit label has a \
line break in it*)
unitlabls = {0.9, -5};(*linespacing for unit labels*)

makeUnitLabel[units_, opts : OptionsPattern[{myTickGrid}]] :=
 DisplayForm[AdjustmentBox[Style[units, LineSpacing -> unitlabls],
   BoxBaselineShift -> OptionValue[UnitLabelShift] +
     If[StringFreeQ[units, "\n"], 0, unitlab2]]]

mynumberformat[n_?NumericQ, q_Integer?Positive,
  opts : OptionsPattern[{NumberForm}]] :=
 Switch[n, _Integer,
  NumberForm[N[n], {Max[0, Last@RealDigits[N[n]]] + q, q},
   Sequence @@ FilterRules[{opts}, Options[NumberForm]],
   DigitBlock -> 3, NumberSeparator -> "\[ThinSpace]"], _,
  NumberForm[N[n], {Max[0, Last@RealDigits[N[n]]] + q, q},
   Sequence @@ FilterRules[{opts}, Options[NumberForm]]]]
(*Needs Max[] with zero because approximate zero yields negative \
number in RealDigits output*)

mynumberformat[n_?NumericQ, opts : OptionsPattern[{NumberForm}]] :=
 Switch[n, _Integer,
  NumberForm[n, Sequence @@ FilterRules[{opts}, Options[NumberForm]],
   DigitBlock -> 3, NumberSeparator -> "\[ThinSpace]"],
          _, NumberForm[N[n], Sequence @@ FilterRules[{opts}, Options[NumberForm]]]]

mynumberformat[n_?NumericQ, Automatic,
  opts : OptionsPattern[{NumberForm}]] := mynumberformat[n, opts]

mynumberformat[n_?NumericQ, 0, opts : OptionsPattern[{NumberForm}]] :=
  mynumberformat[n, opts]
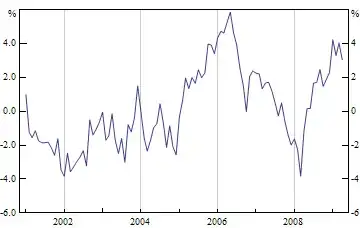
Let's try this with some fake data.
fakedata =
  Transpose@{DatePlus[{2001, 1}, {#, "Month"}] & /@ Range[0, 99],
    Accumulate[RandomVariate[NormalDistribution[0, 1], {100}]]};
Here is a simple example with decimal places on one side and not the other, to demonstrate usage.
DateListPlot[fakedata, Joined -> True, PlotRange -> {-6, 6},
 FrameTicks -> {{myTickGrid[-6, 6, 2, "%", 0.02, DecimalPadding -> 1],
     myTickGrid[-6, 6, 2, "%", 0.02]}, {Automatic, None}}]
One way to do this would be to explicitly state where you want your ticks to go along with exactly how you want them labelled. For example, consider the following plot
Plot[Sin[x], {x, 0, 2*Pi}, Frame -> True]

Let's have points only at -1, 0 and 1 and have them displayed to three decimal places
Plot[Sin[x], {x, 0, 2*Pi}, Frame -> True,
 FrameTicks -> {{{{-1, "-1.000"}, {0, "0.000"}, {1, "1.000"}},
    Automatic}, {Automatic, None}}]

How about this?
Plot[Sin[x], {x, 0, 2*Pi}, Frame -> True,
 FrameTicks ->
  Append[Append[
    Round[#, 0.001] & /@ {Range[0, 2 Pi, 2 Pi/4],
      Range[-1, 1, 0.3]}, None], None]]

FrameTicksor processing already createdFrameTickswithNumberForme.g. Related: tick label precision, number format in ticks, customize your frame ticks. – Kuba Oct 01 '13 at 13:55