4

I am trying to make a series of changes in the appearance of the Plot of some function. I am trying to use Manipulate for my experiments. I tried to change the following code

Manipulate[ Plot[Sin[x], {x, 0, Pi}], {p, HoldForm /@ Options[Plot]}, {q, InputField}]

so that when, for example, p is AxesOrigin ->Automatic and q is changed to {-3,5} then the plot will be updated with Axes Origin at {-3,5}. Similar if p is taken AxesLabeL->None and p is changed to "A label" then the last plot will refreshed showing the label "A label" at the top(without affecting any changes already made in other options like AxesOrigin above).

kornaros
  • 1,047
  • 5
  • 14
  • maybe this can get you started? 
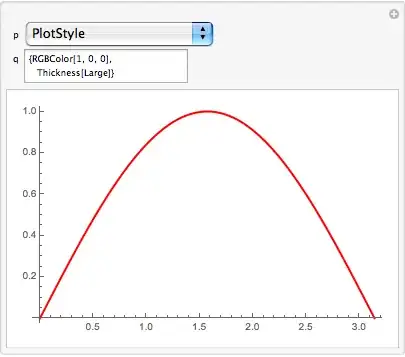
Manipulate[With[{p1=p[[1,1]]},Plot[Sin[x],{x,0,Pi},p1-> q]], {{p,{PlotLabel-> None}, "Options"},Thread[{Options[Plot]}]},{{q,Null,"Value"},InputField}] – chuy Nov 05 '13 at 19:16

4 Answers4

5

Here's a different take on how to present the options, using SlideView rather than drop down, which is pretty nice.

I'm sorry for the fast animation, I had to drop a lot of frames to make its size decent.

{names, symbols, values} = 
  Transpose[Options[Plot] /. (Rule[x_, y_] | RuleDelayed[x_, y_]) :> {x, Unique[x], y}];
tables = 
   Partition[MapThread[Function[{name, symbol}, {
      Pane[name, 150], 
      InputField[Dynamic[symbol]]
   }], {names, symbols}], 10];
MapThread[Set, {symbols, values}];
Panel[
 Column[{
   Dynamic@
    Panel[Pane[
      Plot[Sin[x], {x, 0, 2 Pi}, 
       Evaluate[MapThread[Rule[#, #2] &, {names, symbols}]]], 
      BaseStyle -> {Background -> White}]],
   SlideView[
    TableForm /@ tables
    ]
   }]
 ]

animation

C. E.
  • 70,533
  • 6
  • 140
  • 264
4

Here's way along the lines in the OP:

Manipulate[
 With[{opts = Sequence @@ opts},
  Plot[Sin[x], {x, 0, Pi}, opts]], {p, 
  PopupMenu[Dynamic[p, (q = opts[[#, -1]]; p = #) &],
    Thread[Range@Length@# -> #] &[First /@ Options[Plot]]] &},
 {{q, Null},
  InputField[
    Dynamic[q, (opts = ReplacePart[opts, {p, -1} -> #]; q = #) &]] &},
 {opts, None},
 TrackedSymbols :> {opts}, Initialization :> (opts = Options[Plot])

Mathematica graphics

Michael E2
  • 235,386
  • 17
  • 334
  • 747
3

I don't know if the following code will satisfies you. Of course one could change the code to add more controls like changing 0 and 2Pi corners e.t.c.

f[p_, pt : {___}] := Plot[p[x], {x, 0, 2 Pi}, pt]

 Manipulate[
 If[q =!= Null, PrependTo[r, p[[1, 1]] -> q]]; {p[[1, 1]] -> q, 
  f[Sin, r]}, {p, HoldForm /@ Options[Plot]}, {q, 
  InputField}, {{r, {Axes -> True}}, None}, TrackedSymbols -> {q}]

or similarly,

  Manipulate[If[q =!= Null, PrependTo[r, p[[1, 1]] -> q]]; 
 r = DeleteDuplicates[r, #1[[1]] == #2[[1]] &]; 
 Column@{r, p[[1, 1]] -> q, f[Sin, r]}, {p, 
  HoldForm /@ Options[Plot]}, {q, InputField}, {{r, {Axes -> True}}, 
  None}, TrackedSymbols -> {q}]
kornaros
  • 1,047
  • 5
  • 14
0

Disclaimer -> this is quick and dirty (emphasis on dirty) first attempt:

Manipulate[
 plot[Sin[x],{x,0,Pi},Sequence@@{s,p[[1,1]]-> q}],
 {{p,{PlotLabel-> None}, "Options"},
 Thread[{Options[Plot]}]},
 {{q,Null, "Value"},InputField}, 
 {{s,{}},Block[{s2},Button["Save State", s2=Append[s,p[[1,1]]-> q];DeleteDuplicates[s2];s=s2]]&}, 
 Initialization:> 
  {plot[func_,{x_,xmin_,xmax_},opts:OptionsPattern[]]:= Plot[func,{x,xmin,xmax}, opts]}]

This (as badly written) has the limitations that you can pink box it with bad values for options. In order to "save a state" hit the button. Further changes should respect these previous ones.

chuy
  • 11,205
  • 28
  • 48