2

My question is related to Change all Options of Plot Dynamically where Mathematica remembers the series of changes in the appearance of a drawing using Plot or similar commands like ParametricPlot etc. I would like to generalize my question:

I want to use the Show command for making a nice drawing. I am going to use Plot, ParametricPlot, ListPlot, Graphics, etc., so I need

  1. a popup menu with these commands

  2. An InputField for the data or functions or graphics primitives to be ploted and

  3. a popup menu with the corresponding options. For example, if I select ParametricPlot then I will take the list of options for this command. The series of changes in the drawing have to be "recorded" so that the user could make any possible adjustments at any time!

How would I build such a canvas on which the plots can be added and modified step-by-step?

kornaros
  • 1,047
  • 5
  • 14
  • I hope the "masters" won't close this or put it on hold because I intend to give an extended answer - but it will take a bit of time. – David Park Nov 06 '13 at 20:29
  • @David Park Thank you David! I hope that at some time and with your help we will see extremely useful codes! – kornaros Nov 06 '13 at 20:38
  • 3
    You are asking how to build a mini app. I think you should display the latest version of your code so we can see where you are up to. – Mike Honeychurch Nov 06 '13 at 20:55
  • @Mike Honeychurch. Dear Mike, please have a look at my "Change all Options of Plot Dynamically" question. I can easily introduce an InputField for the function definitions but I actually I have no idea how to implement all the different commands in the same canvas. It's like putting or deleting locators in a locator pane. Also I have no idea how this work could be saved in a file for later use. It seems really hard work. If one give me some ideas then I will try to make this mini app. I haven't seen such app before except Mathematica Drawing Tools... – kornaros Nov 06 '13 at 21:46
  • Well, damn you for putting this on Hold! You just wasted three hours of my time. The question was an extremely good one and there are good answers. This just shows how narrow minded and bigoted this site is. – David Park Nov 07 '13 at 01:44
  • 1
    @DavidPark is your answer lost forever or can you simply not post it due to closure? There is always an option to reopen (which is ongoing now). – Yves Klett Nov 07 '13 at 15:02
  • @Yves Klett It's currently in my DailyReplies2013.nb so it is not lost but just censored. One trouble with most Mathematica sites is that they think only in terms of geeky small scale solutions and lack the vision to see that discovering, understanding and communicating technical ideas is what it's all about. Mathematica is the best medium there is for that but it is not a serious focus of the developers. – David Park Nov 07 '13 at 15:59
  • 4
    @David One of the nice things about this site is that most of the moderation is community managed, and for the most part, democratic. Like in any democracy, there will be people who dislike some of the decisions (closures) and others who feel that things don't go far enough. The difference though, is that here we are willing to listen to reason and re-evaluate decisions. So all you really had to do was to ask nicely here/in chat/via a flag that the question be reopened so that you could post your answer, and we would've done it. There is no need for name calling... The post is now open. Enjoy. – rm -rf Nov 07 '13 at 16:42
  • @kornaros While Nikola's wording might've been unfortunate (the presence or absence of a question mark doesn't make a good question), the spirit of his objection (and Mike's) was that you haven't shown if you've tried anything so far and it reads like "These are my requirements, make me one". You must understand that most people here (esp. the experts who know how to build such apps) only browse for a few minutes/day, so to reach the right audience, it's important to be succinct and show where you're stuck and not have to make them follow a trail of questions to understand your intent. [1/2] – rm -rf Nov 07 '13 at 16:52
  • [2/2] Sometimes that's unavoidable, but this could've very well been a standalone question (and I do think it's a good question). Again, not all questions will face the "what have you tried question" — sometimes it's easy to give an answer to a conceptual question without code or whip up an example if the problem is small enough. If you're comfortable with Mathematica coding and are looking for some insight into planning the framework for the app, then it might help to tell us what your thoughts are on approaching it, so that there's an opportunity to teach and to learn. – rm -rf Nov 07 '13 at 16:53
  • 1
    @rm-rf I have to thank you for expanding on my comment as that is what I was thinking at that moment, but sadly missed the ongoing discussion and the chance to explain the reasons behind my actions. I realise that this is a good question, that it will add that "finished look" to your apps, but the way it was presented... - "This is your homework, you have two days.". – Sektor Nov 07 '13 at 17:21
  • @rm -rf "So all you really had to do was to ask nicely here/in chat/via a flag that the question be reopened so that you could post your answer, and we would've done it." . I guess the wording should be exactly "please reopen it", because when I wrote here http://mathematica.stackexchange.com/questions/35422/how-to-limit-the-argument-to-binary-type-in-mathematica-function that it was possible to write answers that could cover many facet of the question, nothing was reopened. IMBO, you guys are a bit quick on the trigger. – Peltio Nov 07 '13 at 18:26
  • And by the way, it really is frustrating to write and answer directly in the browser and then see a pop up message telling you that you have wasted your time. Not very encouraging further contributions. – Peltio Nov 07 '13 at 18:28
  • @Peltio If you don't ping anyone, then no one gets it (except the OP). Unless someone happens to chance upon it, it goes unnoticed. I saw this one only because Anon and Yves talked about it in chat. I have reopened it for you, but please note that not every closed question should/will be reopened. Some are better left closed. – rm -rf Nov 07 '13 at 18:30
  • 1
    @Peltio Also, this is a community site... everyone plays a part in it. If you see a question that was closed as "Unclear what you're asking" and you think you have a clear idea of what the OP wants (but doesn't twist the question), then why not edit it to improve it? That would've greatly increased chances of reopening... If all people do is to say that others have a fast trigger, then that's not useful. We have an equally fast "reopen trigger"; it just needs to be used. – rm -rf Nov 07 '13 at 18:32
  • 1
    rm -rf (sorry, I cannot place more than one snail it seems) actually I did not see anything to improve in the question. It appeared clear to me (the only other option, that of binary as double argument seemed unlikely - and besides, the answers provided useful examples of argument checking, regardless of what the OP might have meant). As for pinging, forgive my newbiness, I now realize that if I don't add a @name, none of the 'thread killers' will know that a comment has been added. I must say that is was not clear to me from reading the message that stated how to reopen it. – Peltio Nov 07 '13 at 19:00
  • Peltio, you should've started your previous comment with "@", so @rm-rf gets pinged :) – Dr. belisarius Nov 07 '13 at 19:35
  • belisarius, you should've started your previous comment with "@", so @Peltio gets pinged :) – rm -rf Nov 07 '13 at 19:36
  • @rm-rf Damn, I thought this was his question :) – Dr. belisarius Nov 07 '13 at 19:39
  • @Peltio "Thread killers"... hmmm. – Yves Klett Nov 07 '13 at 20:25
  • @Yves Klett I had written "post closers" but I decided that such a word could not exists. As you might have surmised, English is not my mother tongue. Besides "killing" has a precise 'internetwise' meaning that goes beyond that of terminating a biological life, and it could also have positive meaning. As a matter of fact, I am very fond of my Usenet killfile. – Peltio Nov 07 '13 at 20:58
  • @Peltio hey, "surmised" ain't half bad for a non-native speaker :-) ... anyway, point taken. – Yves Klett Nov 07 '13 at 21:08
  • 1
    btw, something close to what you want is available in the Experimental context: Experimental`Explore[]. This used to work well in version 8, as shown in this answer of mine, but unfortunately, doesn't work in version 9. – rm -rf Nov 09 '13 at 07:29

2 Answers2

11

This may help get you started. I once did something similar, but with a different UI, for my multivariable calculus class, but the students' inclination to make things as complicated as possible was sometimes greater than my ability to fix bugs. It was easier and more useful to teach those students how to use Mathematica.

I did not incorporate the popup menu for editing options from my answer here. This was to keep the focus here on adding and editing graphics objects. Since it is the OP's project, I felt that the decisions involved in incorporating such functionality belonged in the OP's hands.

Some sort of simple database seemed needed, which is maintained in the variable allplots. I opted for the following as the basic entry:

{ graphics head, graphics arguments, options, evaluated plot }

The evaluated plot is included so that the code is evaluated only once after the arguments or options are edited. The first entry in allplots is used only for editing options to pass to Show that affect the overall plot.

I didn't spend much time figuring out just which control structures/variables are best. As a result, there are somewhat kludgy dummy variables used merely as an easy way to label the controls that allow the editing of parts of a database entry (graphics, options) and adding a new graphic. Again the OP can decide the exact UI that is desired.

A delete button would be a nice addition.

With[{
   $head = 1,
   $args = 2,
   $opts = 3,
   $plot = 4},
 Manipulate[
  Show[If[Length@allplots > 1, allplots[[2 ;; -1, $plot]], 
    Graphics[]], ReleaseHold@allplots[[1, $opts]]],

  {{allplots, {{Graphics, Null, {}, Graphics[{}]}}, None},
  {{edit, 1}, 
   Thread[Range[Length@allplots] -> 
     Join[{"Overall"}, 
      Show[#, Ticks -> None, FrameTicks -> None, ImageSize -> 40] & /@
        allplots[[2 ;; -1, $plot]]]], PopupMenu},
  {{graphics, Null},(* dummy variable *)
   InputField[Dynamic[allplots[[edit, $args]], 
       (allplots[[edit, $args]] = #; 
        allplots[[edit, $plot]] = allplots[[edit, $args]] /.
         {Null -> Graphics[{}], 
          Hold[{args__}] :> allplots[[edit, $head]][args,
             Evaluate @ ReleaseHold @ allplots[[edit, $opts]]]}) &], 
     Hold[Expression], Enabled -> edit > 1, ImageSize -> Full, 
     FieldHint -> "select graphics to edit"] &},
  {{options, Null},(* dummy variable *)
   InputField[Dynamic[allplots[[edit, $opts]],
       (allplots[[edit, $opts]] = #; 
        allplots[[edit, $plot]] = allplots[[edit, $args]] /.
         {Null -> Graphics[{}], 
          Hold[{args__}] :> allplots[[edit, $head]][args,
             Evaluate @ ReleaseHold @ allplots[[edit, $opts]]]}) &], 
     Hold[Expression], ImageSize -> Full] &},
  {{new, Null},(* dummy variable *)
   PopupMenu[
     Dynamic[new, createObj[#, allplots] &], {Graphics, Plot, ParametricPlot, ListPlot}] &},

  Initialization :> ( (* structure: { head, Hold[{args}], opts, Graphics } *)
   defaultObj[Graphics] = {Graphics, Hold[{{}}], {}, Graphics[{}]};
   defaultObj[Plot] = {Plot, Hold[{x, {x, 0, 1}}], {}, Plot[x, {x, 0, 1}]};
   defaultObj[ParametricPlot] = {ParametricPlot, Hold[{{t, t^2}, {t, 0, 1}}], {}, 
    ParametricPlot[{t, t^2}, {t, 0, 1}]};
   defaultObj[ListPlot] = {ListPlot, Hold[{{{0., 0.}, {0.5, 0.7}, {1., 1.}}}], {}, 
    ListPlot[{{0., 0.}, {0.5, 0.7}, {1., 1.}}]};
   SetAttributes[createObj, HoldAll];
   createObj[head_, database_] := AppendTo[database, defaultObj[head]]
  )
  ]
 ]

Mathematica graphics


Note on edit

One of the subtle things about Manipulate that can frustrate the unaware programmer is that controls are formatted before the Initialization code is executed. That means that the code for the controls should not depend on definitions in the Initialization code. From a fresh kernel, the old control declaration,

{{allplots, {ReplacePart[defaultObj[Graphics], {$args -> Null, $opts -> {}}]}}, None},

initializes allplots to {defaultObj[Graphics]} (literally). Whenever it is used later, after Initialization, it evaluates to

{{Graphics, Hold[{{}}], {}, Graphics[{}]}}}

I had intended it to be as above, with the second element Null so that the field hint is displayed in the InputField for graphics whenever "Overall" is selected.

Michael E2
  • 235,386
  • 17
  • 334
  • 747
  • Dear Michael. Thank you for your answer. Its somehow annoying when I take the following message: Show::gcomb: Could not combine the graphics objects etc Is it possible to "delete" the last drawing that destroyed me work? – kornaros Nov 13 '13 at 22:35
  • @kornaros Yes, a delete button would be nice. Try inserting this before the Initialization option: Dynamic@Button["delete", allplots = Delete[allplots, edit], Enabled -> edit > 1], (untested). It would also be nice to test the input first and not generate the messages. For instance you could use Cases to filter out inputs that do not evaluate to have the head Graphics -- but how would you notify the user of the error? This project has a lot such "problems" to solve, if you want it to be "perfect." – Michael E2 Nov 13 '13 at 22:55
-8

Mathematica, because of its active and dynamic capabilities, is by orders of magnitude the best method of developing and communicating technical ideas. But for various reasons it is seldom used that way. The poster is interested in better capabilities for custom plots, part of better communication, and I confine my answer to that, with a custom table also thrown in. Communication does often require extended discussion.

Mathematica has excellent underlying graphics facilities. It's weak point is in putting them together to produce custom graphics. It is difficult and confusing as opposed to natural and intuitive. This is why there are so many questions on implementing simple graphical solutions. One of the problems is that Mathematica provides many "set-piece" plots, which are nice if you are within the domain of the plot, but difficult once you stray outside. Also the method of combining plots with Show works but is rather arcane, requiring either graphics level jumping (wrapping primitives in Graphics) or the use of Epilog.

I have for a long time worked on a Mathematica Application called Presentations, which I sell for $50. It is an application designed to aid the production of custom graphics, tables, dynamic presentations, and generally literate notebooks. It has a number of essays on using Mathematica and numerous examples. It is 38 MB in size and has 511 files. It started when Version 3 appeared and, as an exercise in reviewing math and learning Mathematica, I worked all the examples and exercises and reproduced all of the graphics in the Thomas/Finney 9th Edition Calculus text. I realized then that the Mathematica paradigm was awkward and produced the first version, which I called DrawGraphics. (I since changed the name because it goes to many matters beyond graphics.)

One way of using Mathematica is to think of a notebook as blank piece of paper on which you are writing your mathematics, which other people might want to read. Similarly, we might think of a graphic as being drawn on the piece of paper, the original poster's canvas.

Presentations treats graphics as just drawing one thing after another where everything is a graphics primitive. It does this by providing routines, for most of the regular plot types, which extract the primitives. Here is an example, which combines a ContourPlot, a Disk, a Circle, a DensityPlot, a regular Plot, a ParametricPlot, a Contour implicit plot, the points generated by Mathematica for the implicit plot, some Text and various graphics directives. Notice that we are just drawing one thing after another.

<< Presentations`
Draw2D[
 {ContourDraw[Sin[x y], {x, -(\[Pi]/2), \[Pi]/2}, {y, -1, 1},
   ColorFunction -> ColorData["Pastel"]],
  Opacity[0.7, ColorData["Legacy", "Orchid"]],
  Disk[{0, 0}, Sqrt[2]/4],
  Black,
  Circle[{0, 0}, Sqrt[2]/4],
  DensityDraw[Sin[x y], {x, -(1/4), 1/4}, {y, -(1/4), 1/4}, 
   ColorFunction -> Hue, PlotPoints -> 8, Mesh -> 8],
  Draw[Sin[x], {x, -(\[Pi]/2), \[Pi]/2}, 
   PlotStyle -> ColorData["Legacy", "Peacock"]],
  ParametricDraw[{Cos[t], Sin[t]}, {t, 0, 2 \[Pi]},
   PlotStyle -> Red],
  ellipse = ContourDraw[x^2 + 3 y^2 == 1, {x, -1, 1}, {y, -1, 1},
    ContourStyle -> Lighter@Blue],
  Black, AbsolutePointSize[5], 
  Normal[ellipse] /. Line[pts_] :> {Point[pts]},
  Black,
  Text["DrawGraphics!", Scaled[{0.95`, 0.1`}], {1, -1}]},
 Frame -> True,
 AspectRatio -> Automatic,
 Background -> ColorData["Legacy", "Linen"],
 ImageSize -> 500,
 BaseStyle -> {FontSize -> 12, FontWeight -> "Bold"},
 PlotLabel -> 
  "Combining Plots, Graphics Primitives\n and Graphics Directives"]

enter image description here

The statement in the notebook is the record for drawing the plot. It is the most direct method and it is easy to edit and reevaluate. I would not go for any more complicated method. The various Plot statements are replaced by Draw statements. Among other things, the Draw statements have a limited set of options - only those options that actually affect the primitives being drawn. (So, for example ImageSize would not be an option that would go into a Draw statement.) On the other hand, the options that affect the overall look of the graphic go at the end. The difference between these two types of options is confusing to many users and somewhat confounded in the common use of the Show statement.

In a notebook, the graphics statement could be closed. Presentations provides an EvaluateBelowButton, which can be pasted into a Text cell preceding the graphics statement and which evaluates the cell. This way the boilerplate specifications can be at a natural place in the notebook, but hidden and, if the reader wishes, the cell can be opened to examine the code.

A graphic, such as above, could also be wrapped in a WindowPresentation routine to display it by the side of a notebook. It there is extended discussion in conjunction with the graphic then this prevents it from being scrolled out of view during the discussion.

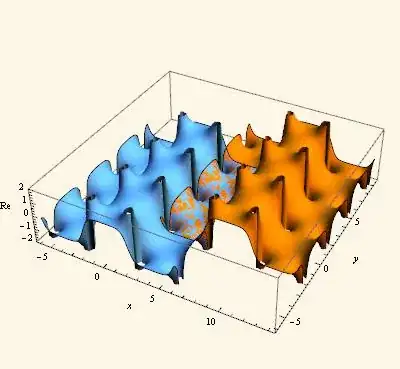
Another feature of Presentations is the recasting of the various graphics transfornations as more convenient post-fix operations. Here we demonstrate the periodicity of the JacobiCD function by superimposing a translated portion of the function on the original function. We draw and save the real part of the surface first and calculate the periods in each direction.

realsurface =
  Draw3D[Re[JacobiCD[x + I y, 2/3]], {x, -6, 6}, {y, -6, 6},
   Mesh -> None];
xperiod = 4 EllipticK[2/3] // N;
yperiod = 2 EllipticK[1 - 2/3] // N;

Then just combine the original and shifted surface. Because we are always dealing directly with the graphics primitives it is easy to not only combine but also manipulate the objects.

Draw3DItems[
 {Opacity[1, Lighter@HTML@DodgerBlue], realsurface,
  Opacity[1, Orange], 
  realsurface // TranslateOp[{xperiod, yperiod, 0}]},
 NeutralLighting[0.3, 0.6, 0],
 NiceRotation,
 PlotRange -> {-2, 2},
 Axes -> True,
 AxesLabel -> {x, y, Re},
 BoxRatios -> {1, 1, 1/4},
 ImageSize -> 400]

enter image description here

An important area of graphics is the representation of complex functions. Here it is convenient to deal directly with complex values, rather than having to squeeze everything through the x + I y filter. The following is an example. We make a plot in the complex plane and save the graphics primitives. (ComplexPolar is just a modulus/argument form of a complex number.)

Draw2D[
 {graphics2D = {DrawPolarMap[
     z, {z, ComplexPolar[1, 0], ComplexPolar[5, 2 \[Pi]]}],
    AbsoluteThickness[2],
    Red, ComplexCurve[2 + 3 E^(I \[Theta]), {\[Theta], 0, 2 \[Pi]}],
    Blue, ComplexCurve[3 + 2 E^(I \[Theta]), {\[Theta], 0, 2 \[Pi]}]}},
 Frame -> True,
 ImageSize -> 300]

enter image description here

Then we map this to the Riemann sphere.

Draw3DItems[
 {ColoredRiemannSphere[],
  graphics2D // StereographicMap},
 ViewRiemann,
 ImageSize -> 300]

enter image description here

So I would hesitate to start designing pop-up windows and InputFields to write graphics. Graphical needs are just far too wide to design some kind of "box" to fit them into. Good graphics require detailed specification and most good graphics are unique. It is better just to have convenient routines to provide common functions and put things together. Edward Tufte, the great designer of data presentations writes: "Those who discover an explanation are often those who construct its representation." It's worth the effort.

There is, in reference to the poster's request, one pop-up item in Presentations, the OptionsFinder. (This routine was contributed by Thomas Münch and Syd Geraghty.) You can click in a name of a routine, in your code, and OptionsFinder will give a list of all the options for that routine (Mathematica routines and loaded package routines). The list will display the default option and there is a link that displays the usage message. Clicking on the link will bring up the help page for the option (if there is one). There is also a link to bring up the help page for the routine. You can also paste the option directly into your code. I use this quite a lot.

The Presentations Application also has a palette that gives quick access to all the routines, with direct links to the individual help pages, and drop-down menus for pasting templates for the various forms of commands.

Graphics is only one example of writing literate notebooks and as a last example I would like to mention one other area - that of composing custom tables. A great deal of information is better presented in tables than with graphics. The Mathematica construct for this is Grid but I wonder how many users actually use Grid, or Mathematica at all, to make custom tables. Most of the specification of a table is done through the use of options, and they are extremely arcane. Presentations has a TableMaker section in which one can compose tables a bit like composing graphics. You specify the content and how you want various parts of the table to look. The following is adapted from the first table I found in Arfken & Weber, Mathematical Methods for Physics, Fifth Edition, 2001, Academic Press. It concerns the particles in the "eightfold way". The original was somewhat confusing. TableMaker also brings up an interactive window showing the current Grid and with buttons that will paste addresses into the code. The Presentations palette has templates for pasting all the commands shown below.

eightfoldgrid =
 MakeTable[eightfold, 9, 6][
  (* Column and group headings *)
  TMSubmatrix[{1, 
    2}, {{"Y", "I", "Particle", "Mass (" <> TMAlign <> "MeV)", 
     "\!\(\*SubscriptBox[\(I\), \(3\)]\)"}}],
  TMSpanMatrix["\[CapitalXi]", {2, 1}, {3, 1}],
  TMSpanMatrix["\[CapitalSigma]", {4, 1}, {6, 1}],
  TMSubmatrix[{7, 1}, {{"\[CapitalLambda]"}}],
  TMSpanMatrix["N", {8, 1}, {9, 1}],

  (* Y Hypercharge values *)
  TMSpanMatrix[-1, {2, 2}, {3, 2}],
  TMSpanMatrix[0, {4, 2}, {6, 2}],
  TMSubmatrix[{7, 2}, {{0}}],
  TMSpanMatrix[1, {8, 2}, {9, 2}],

  (* I Isospin values  *)
  TMSpanMatrix[1/2, {2, 3}, {3, 3}],
  TMSpanMatrix[1, {4, 3}, {6, 3}],
  TMSubmatrix[{7, 3}, {{0}}], TMSpanMatrix[1/2, {8, 3}, {9, 3}],

  (* Particles, masses and isospin component *)
  TMSubmatrix[{2, 4}, 
   Transpose@{{Superscript["\[CapitalXi]", "-"], 
      Superscript["\[CapitalXi]", 0], 
      Superscript["\[CapitalSigma]", "-"], 
      Superscript["\[CapitalSigma]", 0], 
      Superscript["\[CapitalSigma]", "+"], "\[CapitalLambda]", "n", 
      "p"}}],
  TMSubmatrix[{2, 5}, 
   Transpose@{{1321.32, 1314.9, 1197.43, 1192.55, 1189.37, 1115.63, 
      939.566, 938.272}}],
  TMSubmatrix[{2, 6}, Transpose@{{-1/2, 1/2, -1, 0, 1, 0, -1/2, 1/2}}],

  (* Alignment using AlignmentPoint in the fourth column *)
  TMAlignment["Block", ".", {2, 5}, {9, 5}],
  TMAlignment["Item", TMAlign, {1, 5}],
  (* Improve last column with alignment, width and Spacings *)
  TMAlignment["Block", {Right, Center}, {2, 6}, {9, 6}],
  TMItemSize["Column", 2, {1, 6}],
  TMSpacings["Column", 2, {1, 6}, After],

  (* Frames and FrameDividers *)
  TMDividers["Column", GrayLevel[0.7], #, After] & /@ {{1, 3}, {1, 
     4}, {1, 5}},
  TMFrame["ColumnDivider", GrayLevel[0.7], {1, 2}],
  TMDividers["Row", GrayLevel[0.5], #, After] & /@ {{3, 4}, {6, 
     4}, {7, 4}},
  TMFrame["Block", Black, {1, 2}, {1, 6}],
  TMFrame["Block", Black, {2, 1}, {9, 6}],

  (* Backgrounds *)
  TMBackground["Block", ColorData["HTML"]["Wheat"], {1, 2}, {1, 6}],
  TMBackground["Block", 
   ColorData["HTML"]["LightCyan"], {2, 1}, {3, 6}],
  TMBackground["Block", Lighter[Yellow, .7], {4, 1}, {6, 6}],
  TMBackground["Row", ColorData["HTML"]["LightCyan"], {7, 1}],
  TMBackground["Block", Lighter[Yellow, .7], {8, 1}, {9, 6}],

  TMOptions[ItemStyle -> {Bold}],
  TMItemSize["Rows", 1.5]
  ]

enter image description here

I know there are many who object to paying for third party software, no matter how modest the price, but one has to ask if that is fair. Many, but not all, of the routines in Presentations are convenience routines, which you could program for yourself. Again you have to ask yourself how much your time is worth? - quite a lot actually!

Dr. belisarius
  • 115,881
  • 13
  • 203
  • 453
David Park
  • 2,613
  • 18
  • 14
  • 7
    I'm sorry but as always, you miss the question completely and post an unrelated answer that's an advertisement to your software. OP clearly said that they wanted to include popups, list of options, input fields, etc. to make a self-contained app, and your answer does not mention any of that! The problem has never really been an objection to 3rd party software. There are plenty of others with stuff for sale/free that are doing just fine here. Rather the problem most people have is when you miss an opportunity for an excellent teaching moment and use it instead for a boring sales pitch [1/3] – rm -rf Nov 07 '13 at 18:18
  • 7
    With your earlier cries of "narrow mindedness" of interpretation and "bigotry" shown by the site users, I thought that your answer was going to be general and actually answer the question in detail, which was "How do I make a drawing canvas". Instead, your answer showed the same narrow mindedness in interpretation and only demonstrates what can be done with your package. It completely ignores the requirements of the question. Usually, apps like the OP's are not designed for communication (like in a journal paper), but for easy viewing, plotting and interactive exploration by newbies. [2/3] – rm -rf Nov 07 '13 at 18:19
  • 6
    A good answer to this question would have 1) Shown the basic steps of designing a canvas from scratch in vanilla Mathematica, talked about things to consider (such as the different coordinate systems, scaled coordinates, ticks, labeling, re-styling without re-plotting, etc.) 2) Indicated how that could be extended in ways that the OP wants (popups, dropdowns, inputfields, etc.) and after that, if you wanted to peddle your warez, then fine. I'm sorry, but I'm downvoting this, despite the fact that I respect your skills and the effort you have put into designing this package. [3/3] – rm -rf Nov 07 '13 at 18:20
  • Excuse me! He wanted to easily combine many types of plots and primitives. I showed how that can be done with an existing app. He wanted a pop-up for options. The app has that, and better than you would design. He wanted a way of maintaining a permanent record for reproducing the graphics and I showed the best way for doing that. Sorry, but you guys ARE narrow minded and cheap besides! – David Park Nov 07 '13 at 18:34
  • 1
    BTW, in case the OP needs it, here is the popup code for the options mentioned in this answer. It doesn't do what the OP requires, but perhaps can be extended in that direction http://forums.wolfram.com/mathgroup/archive/2009/May/msg00351.html – Dr. belisarius Nov 07 '13 at 18:41
  • 4
    @DavidPark Please reconsider your way of answering in this site. Many of us are consultants (we sell our time instead of an application), but what good could I do by answering "if you pay a few hours of my time, I can do that for you"? I'm quite sure you can help the OP a lot more by explaining him how you could do his canvas, from the ground up – Dr. belisarius Nov 07 '13 at 18:45
  • 10
    -1 I would prefer an answer something along the lines of "Here's some code to get you started... but if you are interested, my Presentations package has a much more complete and robust implementation." – WReach Nov 07 '13 at 18:56
  • @Belisarius I said that I am quite certain that one cannot write a palette type app from which one can create general useful graphics. You seem to have missed the point. Graphical presentations are simply to varied and particular for that approach to work. So spend your time on it if you want, and good luck. – David Park Nov 07 '13 at 19:20