7

I am studying an infinite square well in the context of quantum mechanics.

ClearAll["Global`*"];

(* Length of the well *)
L = 1;

(* The eigenfunctions, n=1,2,3,... *)
u[n_, x_] := Sqrt[2/L] Sin[n π x / L]

(* Probability density function, ρ[x] = |u[n,x]|^2 *)
ρ[n_, x_] := Simplify[u[n, x]\[Conjugate] u[n, x], {n ∈ Integers, x ∈ Reals}]

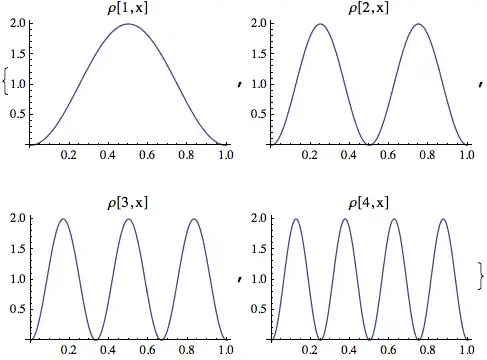
(* Plots of ρ[n,x] for various values of n *)
Table[ Plot[ρ[n, x], {x, 0, L}, PlotLabel -> "ρ[" <> ToString@n <> ",x]"], {n, 1, 4}]

And here is the output:

enter image description here

My questions is:

Can I use Mathematica pattern magic to rewrite PlotLabel -> "ρ[" <> ToString@n <> ",x]" ?

For instance, I tried (although I knew it wouldn't work): PlotLabel -> HoldForm@ρ[n,x], but that of course leaves n unevaluated as well, although I would like n to be evaluated and then the result to be held.

stathisk
  • 3,054
  • 20
  • 37

4 Answers4

9

I think your original method is fine, but perhaps this will be more to your liking:

Table[With[{n = ni},
  Plot[ρ[n, x], {x, 0, L}, PlotLabel -> Defer@ρ[n, x]]
  ], {ni, 1, 4}]

Another, perhaps less fundamental way is

Table[
    Plot[ρ[n, x], {x, 0, L}, PlotLegends -> Placed["Expressions", Top]]
 ,{n, 1, 4}]

Example image

Ajasja
  • 13,634
  • 2
  • 46
  • 104
  • 2
    Would be ok to use HoldForm[] instead of Defer[] here ? I tried it and it works, but are there any caveats? – stathisk Nov 06 '13 at 23:29
  • 1
    @Zet Yes, of course, HoldForm is probably even safer as Defer gets evaluated when given explicitly as input. – Ajasja Nov 06 '13 at 23:36
5

This is probably more Mathematica-ish. But sincerely, I would go with your solution :D

Table[Plot[ReleaseHold@# /. n -> r, {x, 0, L}, 
           PlotLabel -> (# /. n -> r)] &@HoldForm[ρ[n, x]], {r, 1, 4}]

Mathematica graphics

Dr. belisarius
  • 115,881
  • 13
  • 203
  • 453
4

I'm always a fan of making a new function for plotting any time I'm going to do the same type of plot multiple times.

\[Rho]plot[n_, plotopts : OptionsPattern[]] := 
 Plot[\[Rho][n, x], {x, 0, L}, 
  Evaluate[FilterRules[{plotopts}, Options[Plot]]], 
  PlotLabel -> "\[Rho][" <> IntegerString[n] <> ",x]"]

Now you can do a simple plot like

\[Rho]plot[1]

and get

enter image description here

or you can add any options to it to fancy it up:

Grid[Partition[
  Table[\[Rho]plot[n, ImageSize -> 400, BaseStyle -> 20, 
    Frame -> True], {n, 4}]
  , 2]]

enter image description here

Jason B.
  • 68,381
  • 3
  • 139
  • 286
3

To my simple mind all the approaches suggested so far are overkill. I would do it the simple way -- I would use Row.

Table[Plot[\[Rho][n, x], {x, 0, L},
   PlotLabel -> Row[{"ρ[", n, ",\[ThinSpace]x]"}]], {n, 1, 4}]

Please take note of the use of a thin-space glyph. It is needed to make the spacing look right.

plots.png

m_goldberg
  • 107,779
  • 16
  • 103
  • 257