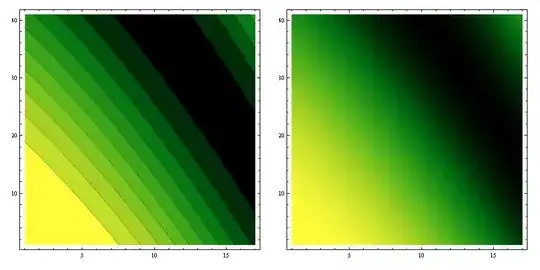
During the debugging of my previous question (somewhat related), I encountered this strange behaviour: when the global option Antialiasing is set to True in Option Inspector, the following code gives non-antialiased plots (observe e.g. frames):
GraphicsRow@{
  ListContourPlot[
   Table[Sin[i + j^2], {i, 0, 2, 0.05}, {j, 1.2, 2, 0.05}],
   ColorFunction -> ColorData["AvocadoColors"], Contours -> 10,
   Mesh -> False, ImageSize -> 400],
  ListDensityPlot[
   Table[Sin[i + j^2], {i, 0, 2, 0.05}, {j, 1.2, 2, 0.05}],
   ColorFunction -> ColorData["AvocadoColors"], Mesh -> False,
   ImageSize -> 400]
  }
The next input is from the same notebook, same session, the only difference is that GraphicsRow only contains one plot object. Result is antialiased (visible polygon edges are of no concern here, see other post).
GraphicsRow@{ListContourPlot[
   Table[Sin[i + j^2], {i, 0, 2, 0.05}, {j, 1.2, 2, 0.05}],
   ColorFunction -> ColorData["AvocadoColors"], Contours -> 10,
   Mesh -> False, ImageSize -> 400], ""}

Question
Is it a bug of GraphicsRow?
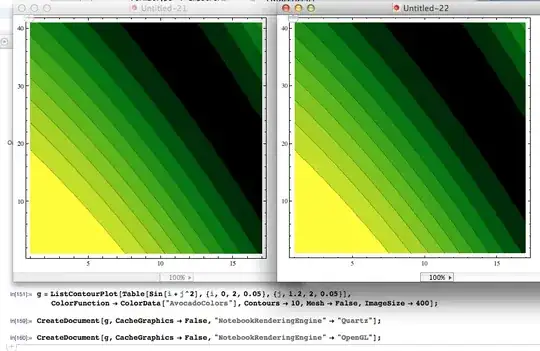
GraphicsRowobjects produces different outputs. The first two plots seem to be non-antialiased, the second has the visible polygon edges. – István Zachar Jan 20 '12 at 21:41