After some fiddling around I came up with this function:
Clear[gitter]
gitter[xspec_, yspec_, logPlot_: False] :=

  Module[{min, max, d, xlines, ylines, i},
   xlines = ylines = None;
   Switch[xspec,
    Automatic, xlines = Automatic,
    {_?NumericQ, _?NumericQ, _?NumericQ},
    {min, max, d} = xspec;
    xlines = Range[min, max, d],
    {_?NumericQ, _?NumericQ, _List},
    {min, max, d} = xspec;
    If[logPlot == False,
     xlines = (Log10[#] &) /@ Flatten[Table[10^i*d, {i, min, max}]],
     xlines = Flatten@Table[10^i d, {i, min, max}]]
    ];
   Switch[yspec,
    Automatic, ylines = Automatic,
    {_?NumericQ, _?NumericQ, _?NumericQ},
    {min, max, d} = yspec;
    ylines = Range[min, max, d],
    {_?NumericQ, _?NumericQ, _List},
    {min, max, d} = yspec;
    If[logPlot == False,
     ylines = (Log10[#] &) /@ Flatten[Table[10^i*d, {i, min, max}]],
     ylines = Flatten@Table[10^i d, {i, min, max}]]];
   {xlines, ylines}];
It handles three cases:
(1) Linear scale: The parameters have the form {min, max, step}
(2) logarithmic scale in a normal Plot: The parameters have the form {min, max, istOfValues}
(3) LogPlot or LogLogPlot: as in (2) but the optional Parameter LogPlot has to be set to True.
Examples:
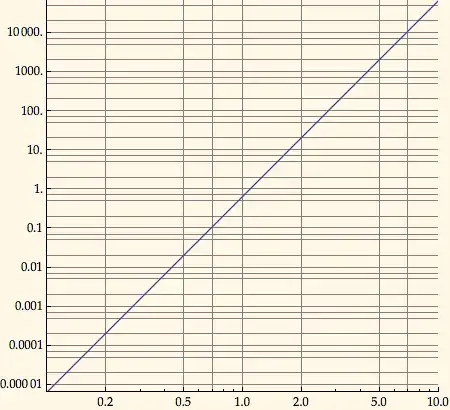
grid = gitter[{-1, 1, {1, 2, 5, 7}}, {-5, 5, {1, 2, 5, 7}}, True];
lp = LogLogPlot[2 x^5/3, {x, 0.1, 10}, GridLines -> grid,
  PlotRangePadding -> 0, AspectRatio -> 1,
  Ticks -> {Automatic, Table[10.^i, {i, -5, 5}]}]
gives:
and
yticks = Tickmarken[0, 5, {1}, {2, 3, 5, 7}];
gitter = Gitter[{-2, 10, 1}, {0, 5, {1, 2, 3, 5, 7}}];
plot = Plot[Log10[2 E^x], {x, -2, 10}, Ticks -> {Automatic, yticks},
  GridLines -> gitter]
gives:

Tickmarken is a function, I use to make Ticks.

LogLogPlot[2 x^5/3, {x, 0.1, 10}, GridLines -> {{.2, .5, 1, 2, 5}, {.001, .01, .1, 1, 10, 100, 1000}}]? – Szabolcs Apr 09 '12 at 15:36LogLogPlot? – rcollyer Apr 09 '12 at 15:37LogLogPlot[2 x^5/3, {x, 0.1, 10}, GridLines -> {Range[5], Automatic}]or the other way around... – Jens Apr 09 '12 at 15:42gridlines[{1,2,5},{1,3,7}], which sets lines in each decade at these values. – Peter Breitfeld Apr 09 '12 at 15:48GridLines -> {Automatic, Flatten@Table[{1, 2, 5} 10^i, {i, -5, 5}]}or something similar? – Szabolcs Apr 09 '12 at 15:58