4

Bug introduced in 10.0.0 and fixed in 10.0.1


Version 10:

This works:

  grids[min_, max_] := Table[If[EvenQ[i], {i, Red}, {i, Blue}], 
       {i, Ceiling[min], Floor[max], 1}];
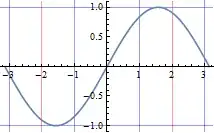
  Plot[Sin[x], {x, -Pi, Pi}, GridLines -> grids]

Mathematica graphics

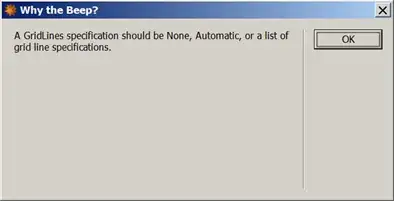
But when used with LogPlot it gives an error:

LogPlot[x^x, {x, 1, 5}, GridLines -> grids]

Mathematica graphics

Mr.Wizard
  • 271,378
  • 34
  • 587
  • 1,371
Nasser
  • 143,286
  • 11
  • 154
  • 359
  • Nuts; so I can't even use a custom function! :-S – Mr.Wizard Jul 12 '14 at 09:10
  • @Mr.Wizard WRI wants to make it really hard not to have nice log spaced gridlines for LogPlot :) – Nasser Jul 12 '14 at 09:11
  • I don't mean to boss your question but I find the Accepted answer unsatisfying. In the past the GridLines -> {func, func} form worked; now it does not. This is still a v10 bug/regression/ugliness and I don't think the matter should be concluded merely because some aspect of that option still works. One of us could start a new Question about the bi-axis form but I think it better to keep this in one place. (Thanks to mine we already have two related questions.) – Mr.Wizard Jul 12 '14 at 09:55
  • @Nasser as an author of an answer, please, remove accept. I'm currently filling the issue for Wolfram Support. – m0nhawk Jul 12 '14 at 10:01
  • 3
    I've reported the issue for Wolfram Support, [CASE:1212405]. – m0nhawk Jul 12 '14 at 10:11

1 Answers1

2

For LogPlot and LogLogPlot you need to specify both grids, vertical and horizontal.

grids[min_, max_] := 
  Table[If[EvenQ[i], {i, Red}, {i, Blue}], {i, Ceiling[min], 
    Floor[max], 1}];
LogPlot[x^x, {x, 1, 5}, GridLines -> {grids, Automatic}]

enter image description here

And for {grids, None}:

enter image description here

m0nhawk
  • 3,867
  • 1
  • 20
  • 35
  • 2
    Interesting observation, but what about grid-lines for the log direction? GridLines -> {grids, grids} does not work. – Mr.Wizard Jul 12 '14 at 09:31