4

I have four equations, $$ z = xy \\ z=0 \\ y=x^2 \\ x=y^2$$ I would like to integrate the region bounded by them.

Before this, I would like to plot the region they bound, but I cannot seem to find any documentation on how to do this with Plot3D or RegionPlot3D

NictraSavios
  • 143
  • 1
  • 7
  • Try ContourPlot3D. – Kuba Jan 27 '14 at 15:03
  • 2
    These surfaces partition space into several segments. To select the one you need, you must rewrite them as inequalities, not as equations. Then it's trivial to plot the region using RegionPlot3D. – Szabolcs Jan 27 '14 at 16:01
  • Maybe a duplicate of (39161)? – Silvia Jan 27 '14 at 19:49
  • @Mr.Wizard Maybe a duplicate, but I don't think it is unclear. In this case it seems there is one region bounded (with finite volume) by those surfaces. I mean, region bouded by x^2+y^2=1 is a sphere, while x^2+y^2<=1 is a sphere. – Kuba Jan 29 '14 at 12:52
  • @Kuba Most people seemed to feel that it was ambiguous, and I tended to agree. Since you disagree please vote to reopen. – Mr.Wizard Jan 29 '14 at 12:57
  • @Mr.Wizard You are right :P – Kuba Jan 29 '14 at 13:04
  • @Kuba I suppose what people mean by "unclear" is that = doesn't indicate if he wants the region "inside" or "outside" (or left/right, above/below, etc.). To use your example, does x^2 + y^2 =1 imply the solid sphere with radius 1 or the entire space except that sphere? :) Since the OP seems to have accepted your answer, please edit the question to fit the best possible interpretation and I'll gladly add a reopen vote :) – rm -rf Jan 29 '14 at 18:21
  • @rm-rf Yes = doesn't but with: "I would like to integrate the region bounded by them." it is clear we are talking about finite volume :). It is not obvious such region exists but OP does not share this concern with me. And existance or finding those regions are separate questions. That's why I have nothing to edit :/. – Kuba Jan 29 '14 at 23:11
  • @Kuba I haven't tried it out myself, but I thought halirutan's answer was showing that there are many regions bounded by these equations... is that not the case? – rm -rf Jan 30 '14 at 00:01
  • @rm-rf I have not checked it very carefully but I think there is only one, others are bouded by plot region. – Kuba Jan 30 '14 at 05:58
  • @Kuba OK, I've reopened it :) – rm -rf Jan 30 '14 at 16:56

2 Answers2

8

I dont know how to do this automatically, to find bouded region given with those surfaces. I guess ou could take each three and check if there is a finite intersection and then combine the result.

Meanwhile you can plot it as I've suggested and as Nasser has shown to get an idea what to loog for:

ContourPlot3D[{z==x y, z==0, y==x^2, x==y^2}, {x, #, #2}, {y, #3, #4}, {z, #5, #6},
    Mesh -> 1, ImageSize -> 500, BaseStyle -> 18, ViewPoint -> {5, 1, 2},
    ContourStyle -> (Directive @@@ {{Red}, {Green}, {Blue, Opacity@.3}, {Yellow}}),  
    Lighting -> "Neutral", AxesLabel -> {"x", "y", "z"}
] & @@@ {{-2, 2, -2, 2, -2, 2}, {0, 1, 0, 1, -.1, 1.1}} // Row
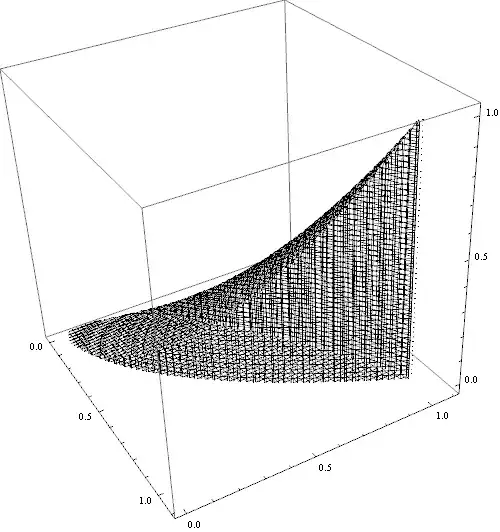
enter image description here

Ok, now we know:

RegionPlot3D[And @@ {z <= x y, z >= 0, y > x^2, x > y^2},
             {x, -.02, 1.1}, {y, -.02, 1.1}, {z, -.02, 1.02}, 
             Mesh -> 50, ImageSize -> 500, PlotPoints -> 100, MaxRecursion -> 10, 
             PlotStyle -> None]

enter image description here

Hard to get that tip in {0,0,0} :/. Ok, copy and paste first part of former code:

NIntegrate[ Boole[And @@ {z <= x y, z >= 0, y > x^2, x > y^2}], 
           {x, -.02, 1.1}, {y, -.02, 1.1}, {z, -.02, 1.02}]
0.0833333
Kuba
  • 136,707
  • 13
  • 279
  • 740
5

Your question, in its current form, is ambiguous and cannot be answered. Your equations don't bound a region, i.e. they only define surfaces. It is clear what you mean, but important information is missing.

If you want to use RegionPlot3D, you have to decide which side of the surface of each equation you consider to be inside. For your first equation, this could be $z\leq x y$ or $z\geq x y$. One way to find out which combination of inequalities you want is to make all combinations and look at them

eqs = {z == x y, z == 0, y == x^2, x == y^2};
With[{possibilities = (Apply @@@ Transpose[{#, eqs}]) & /@ 
    Tuples[{GreaterEqual, LessEqual}, 4]},
 RegionPlot3D[And @@ #, {x, -10, 10}, {y, -20, 20}, {z, -20, 20}] & /@
   possibilities
 ]

Mathematica graphics

OK, since the rest is done in Kubas answer, I'll stop here and leave this as it is.

halirutan
  • 112,764
  • 7
  • 263
  • 474