I would like to show an exclusion plot, by having a filling made of parallel tilted lines. Any ideas?
Something along these lines

I would like to show an exclusion plot, by having a filling made of parallel tilted lines. Any ideas?
Something along these lines
RegionPlot[x^2 + y^3 < 2, {x, -2, 2}, {y, -2, 2},
MeshFunctions -> {(2 #1 - #2) &, (2 #1 - #2) &}, Mesh -> 100]

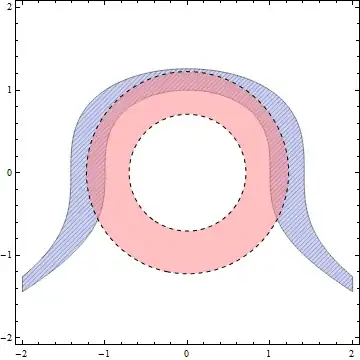
Show[RegionPlot[1 < x^2 + y^3 < 2, {x, -2, 2}, {y, -2, 2},
MeshFunctions -> {#1 - #2 &}, Mesh -> 100],
RegionPlot[0.5 < x^2 + y^2 < 1.5, {x, -2, 2}, {y, -2, 2},
PlotStyle -> {Pink, Opacity[0.5]}, BoundaryStyle -> Dashed]]