The following threads call our attention to the fact that "accuracy of Interpolation will be worse with an unstructured grid", in the context of interpolation of 3d data:
Improved interpolation of mostly-structured 3d data
I want to know if there is a systematic way to do the interpolation correctly for a 3D data with the points distributed logarithmically along x and y.
Simple example
The xy grid would be built using
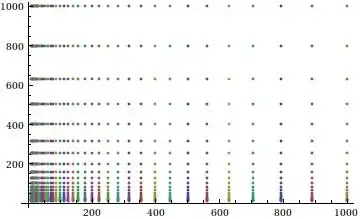
grid = Table[ {10^t, 10^u}, {t, 1, 3, 0.05}, {u, 1, 3, 0.1}]
ListPlot[ grid ]
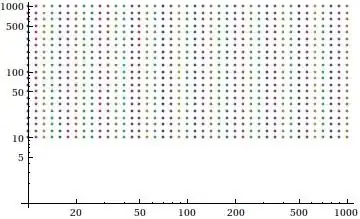
Of course, in logarithmic scale it looks fine (linear):
ListLogLogPlot[ grid ]
The 3D data would be built using some 2 variable function func:
tabx = Table[10^w, {w, 1, 3, 0.05}]
taby = Table[10^w, {w, 1, 3, 0.1}]
tab = Table[ {{x,y},func[x, y]}, {x, tabx}, {y, taby}]
Then, how to interpolate tab properly?
Interpolationworks fine and gives high-order interpolation, although you have to useFlatten[tab, 1]to get rid of the nesting. It seems Mathematica still considers your data a structured grid, because it still has the structure of a full grid even though the $x$ and $y$ coordinates are nonuniformly sampled. – Feb 15 '14 at 19:45InterpolationandListInterpolatonfor multidimensional data. Is there any difference? Maybe I am missing something. – fcpenha Feb 16 '14 at 02:02