I have a 3D surface given in data-points of the form ${x,y,z}$. What is the easiest way to get the interpolated value $z=f(X,Y)$ for given coordinates ${X,Y}$ (which are of course not in the data list)?
Asked
Active
Viewed 1.9k times
2 Answers
21
Mathematica's interpolation function, Interpolation, works on multidimensional data. For example,
data = Flatten[Table[{x, y, x^2 + y^2}, {x, -10, 10}, {y, -10, 10}], 1];
int = Interpolation[data];
Then, you can extract the values for values between the data points:
int[1.1, 1.1]
(* ==> 2.42 *)
And Plot3D, or whatever else you want.
Plot3D[int[x, y], {x, -10, 10}, {y, -10, 10}]
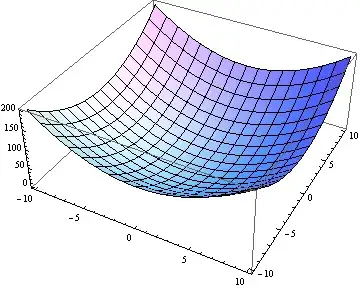
Note, that the interpolation is pretty good:
exact[x_, y_] := x^2 + y^2
int[1.1, 1.1] == exact[1.1, 1.1]
(* => True *)
Or better yet (thanks @rcollyer):
(int[1.1, 1.1] - exact[1.1, 1.1])/exact[1.1, 1.1]
(* 1.83508*10^-16 *)
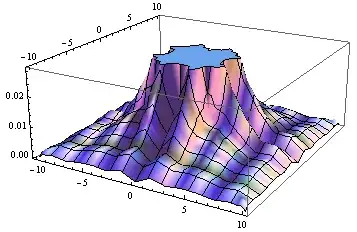
Update Leonid's comment below pointed out that the accuracy of Interpolation will be worse with an unstructured grid. For example:
dataDelete = Delete[data, RandomInteger[{1, Length[data]}]]
intD = Interpolation[dataDelete]
Then,
(intD[1.1, 1.1] - exact[1.1, 1.1])/exact[1.1, 1.1]
(* ==> 0.0743802 *)
which is worse. It seems particularly bad close to the origin:
Plot3D[(intD[x, y] - exact[x, y])/ exact[x, y], {x, -10, 10}, {y, -10, 10}]
Eli Lansey
- 7,499
- 3
- 36
- 73
17
Interpolation. Let's create some 100x3 data matrix, coloumns representing x, y and f(x,y), covering the domain from [1,10], sampled at the integers for both x and y
data = Join[Tuples[{Range[10], Range[10]}], RandomReal[20, {100, 1}],
   2];
Now, I have to apply Interpolation to the data, but after grouping it as a list of {{x, y}, f[x,y]} values
f = Interpolation[Through@{Most, Last}[#] & /@ data];
You can use f as a regular function, if you keep inside the bounds of your sampling.
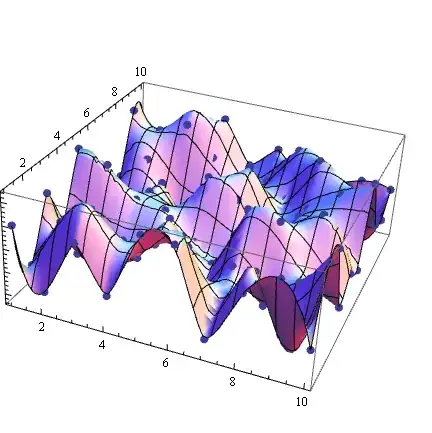
Let's see the results graphically
Show[ListPointPlot3D[data, PlotStyle -> PointSize[Large]],
 Plot3D[f[x, y], {x, 1, 10}, {y, 1, 10}]]
Rojo
- 42,601
- 7
- 96
- 188
int[1.1, 1.1] - exact[1.1, 1.1]? That gives a better indication of fitness thenEqual. – rcollyer Apr 26 '12 at 15:58Interpolationonly works on structured grids, while on unstructured ones the interpolation order will be reduced to 1, which in most cases will not be good enough. Try deleting one of the points from your regular grid to see what I mean. – Leonid Shifrin Apr 26 '12 at 16:03