11

I am trying to show a gradient field behind a plot, and then its density in a separate plot below.

I understand (as in this question) that this must normally be done using the ImagePadding directive. However, that does not quite align the plots in this case:

padding = {{20, 30}, {20, 30}}; 
GraphicsColumn[
  {
   Show[
    DensityPlot[PDF[NormalDistribution[0, 1], Log[x/40]] , 
      {x, 15, 60}, {y, 0, 30}, 
      ColorFunction -> "SunsetColors"], 
    Graphics[{Dashed, Gray, Line[{{40, 0}, {40, 30}}]}], 
    Plot[If[x < 20, 10, If[x < 25, 2 x - 30, 20]], {x, 15, 60}, 
      PlotRange -> {0, 30} , 
      PlotStyle -> {RGBColor[0.5, .7, 0.2], Thickness[0.01]}], 
    ImagePadding -> padding, PlotRangePadding -> None
   ], 
   Plot[PDF[NormalDistribution[0, 1], 5 Log[x/40]] , {x, 15, 60}, 
      PlotStyle -> {RGBColor[1, 0.4, 0], Thickness[0.01]},
      ImagePadding -> padding]
  }
]

Align me

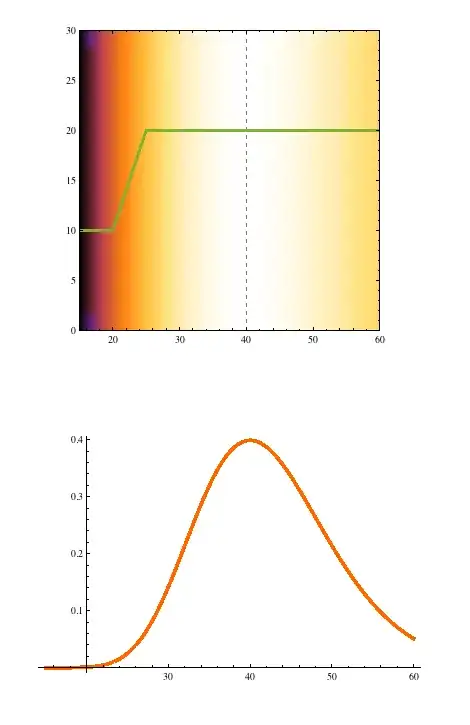
Is there a way to get the abscissa ranges to match?
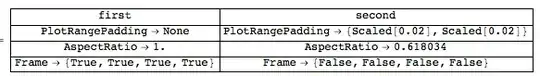
Brian B
  • 1,553
  • 1
  • 13
  • 20

2 Answers2

13

AbsoluteOptions shows there to be several differences between the output settings of the first and second plots:

Grid[Prepend[Transpose[
     AbsoluteOptions[#, {PlotRangePadding, AspectRatio, 
           Frame}] & /@ {plot1, plot2}], {"first", "second"}], Frame -> All]

settings

It'll look better if you use the same aspect ratio (I used 1/GoldenRatio) and a frame in each picture. I also set PlotRangePadding-> None in the second case.

plots

DavidC
  • 16,724
  • 1
  • 42
  • 94
  • Your method of examining AbsoluteOptions is very generalizable. I think it's great. – Brian B Apr 16 '12 at 02:05
  • Thanks. It's probably still a good idea to first scan the output of AbsoluteOptions[plot1] and AbsoluteOptions[plot2] to identify the options you want to compare. – DavidC Apr 16 '12 at 12:21
4

Use for example Framed[]:

padding = {{20, 20}, {20, 20}};
GraphicsColumn[{
  Framed[Show[
    DensityPlot[
     PDF[NormalDistribution[0, 1], Log[x/40]], {x, 15, 60}, {y, 0, 
      30}, ColorFunction -> "SunsetColors"],
    Graphics[{Dashed, Gray, Line[{{40, 0}, {40, 30}}]}], 
    Plot[If[x < 20, 10, If[x < 25, 2 x - 30, 20]], {x, 15, 60}, 
     PlotRange -> {0, 30}, 
     PlotStyle -> {RGBColor[0.5, .7, 0.2], Thickness[0.01]}], 
    ImagePadding -> padding, PlotRangePadding -> None], 
   FrameStyle -> Directive[White]],
  Framed[Plot[
    PDF[NormalDistribution[0, 1], 5 Log[x/40]], {x, 15, 60}, 
    PlotStyle -> {RGBColor[1, 0.4, 0], Thickness[0.01]}, 
    ImagePadding -> padding, Frame -> True], 
   FrameStyle -> Directive[White]]}]

enter image description here

Dr. belisarius
  • 115,881
  • 13
  • 203
  • 453