While Szabolcs's method works beautifully for standard plots, anything more complicated with nonuniform AspectRatios fails. Let's generate some plots with varying image padding, sizes and ratios:
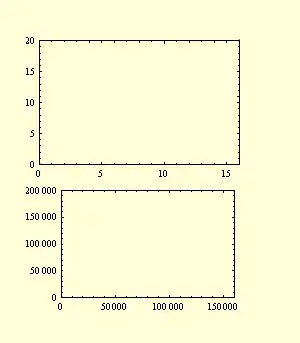
a = Plot[2 Sin[x] + x, {x, 0, 16}, Filling -> Bottom,
   PlotRange -> {{0, 16}, {0, 20}}, Frame -> True, ImageSize -> 400];
b = ArrayPlot[RandomReal[{0, 1}, {20, 20}],
   PlotRange -> {{0, 160000}, {0, 200000}}, Frame -> True,
   FrameTicks -> {
     {MapIndexed[{First@#2, #1} &, Range[0, 160000, 8000]], None},
     {MapIndexed[{First@#2, Rotate[#1, -\[Pi]/2]} &, Range[0, 200000, 10000]], None}},
   ImageSize -> 300, AspectRatio -> 1, ColorFunction -> (Hue[#1, .7, 1] &)];
c = BarChart[{1, 2}, Frame -> True, ImageSize -> 200, AspectRatio -> 2];

Row@{a, b, c}

The default layout is far from visually appealing. Here I provide the package-ready plotRow function that builds on Szabolcs's (and Heike's) approach when estimating padding and also accounts for AspectRatios by querying them directly from plots. One only has to specify the desired vertical size (200) to easily align frames.
padding[g_Graphics] := With[{im =
   Image[Show[g, LabelStyle -> White, Background -> White]]}, BorderDimensions@im] + 1;
plotRow[g : {__Graphics}, y_] := Module[{ip = padding /@ g, ar},
   ip = ReplacePart[ip, {_, 2} :> Max /@ Transpose[Last /@ ip]];
   ar = (AspectRatio /. Options@# /. Automatic -> 1./GoldenRatio) & /@ g // N;
   MapThread[Show[#1, ImagePadding -> #2, AspectRatio -> #3,
      ImageSize -> ({y/#3, y} + Plus @@@ #2)] &, {g, ip, ar}]
 ];

Row@plotRow[{a, b, c}, 200]

The same can be easily done for a vertical layout by modifying the appropriate parts of plotRow.