10

I would like to measure the density of my western blot band by measuring the area under the peak from this plot.

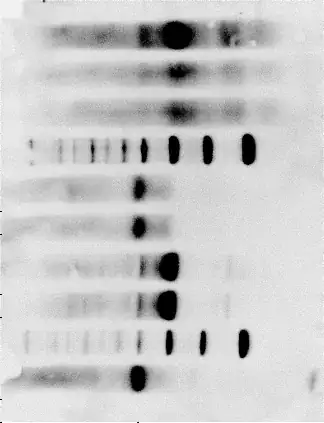
More specifically, my image will have several lanes with a pattern of bands in each lane (see link below). I would like to select an area and then measure the intensity of the bands as scanned from top to bottom.

I would do this for each lane by selecting same area (essentially move my rectangle over to the new lane) and then plot the density vs length of gel (down direction). I would then like to integrate the area under each curve to get a value which can then be compared to the pattern and density (increased or decreased) of the neighboring lane.

Is this possible to do in Mathematica and, if so, how can I do it. I'm very new to Mathematica and any help would greatly be appreciated.

http://i2.wp.com/homemadeprojects.org/wp-content/uploads/2014/02/gel.png


Keywords: line, lines, spectrum, spectral

Kuba
  • 136,707
  • 13
  • 279
  • 740
user12617
  • 121
  • 5

2 Answers2

17

Here's my go:

pic = Import["http://www.agrisera.com/dokument/bibliotek/sample_quality1.jpg"];
Framed[pic]

enter image description here

Isolate the picture by deleting rows and columns with mostly white, and reorient for convenience.

pic2 = pic // ImageData // {#, Transpose@#} & // Count[#, {1., 1., 1.}]/Length[#] & /@ # & /@ # & // Flatten[Position[#, n_ /; n < .35]] & /@ # & // {Min@#, Max@#} & /@ # & // ImageTake[pic, Sequence @@ #] & // ImageRotate[#, -Pi/2] & // ImageReflect[#, Left] &

enter image description here

Crop picture by creating a bounding box around black pixels, with minor manual adjustments (+ {-5, -25}), then split the picture into 10 evenly spaced rows. Convert to grayscale to simplify density calculations.

lanes = pic2 // ImageData // Position[#, {0., 0., 0.}, Infinity] & // Transpose // {First@#, Last@#} &@First@# & // ImageTake[ColorNegate@pic2, # + {-5, -25}] & // ImagePartition[ColorConvert[#, "Grayscale"], {1, .1}*ImageDimensions[#]] & // Flatten;

enter image description here

For each lane, take the mean gray level, by column, and plot it. I had trouble interpolating and then integrating, so instead as a lazy option I rasterized each plot and took the ratio of blue (filling) to white (background).

plots = (Mean /@ Transpose[ImageData[#] - .1] &@# // ListPlot[#, Joined -> True, Filling -> Axis, PlotRange -> {Automatic, {0, 1}}] &) & /@ lanes};
scores = Divide @@ Reverse[SortBy[Tally[Flatten[ImageData[Rasterize[#]], 1]], -Last@# &][[;;2, -1]]] & /@ plots // N;
{lanes, plots, scores} // Transpose // Grid

enter image description here

mfvonh
  • 8,460
  • 27
  • 42
12

This tries to "automatically" detect equal width bands (although they can be unequally spaced):

i = Import["http://www.agrisera.com/dokument/bibliotek/sample_quality1.jpg"]; 
mask = FillingTransform[DeleteSmallComponents[
         Binarize@ImageMultiply[Erosion[i, 3], EntropyFilter[i, 3]], 1000], 1];
u = ImageMultiply[i, mask]; 
v = Quiet[Variance /@ ((Transpose@ImageData@ColorConvert[u, "Grayscale"]) /. 
     0. | 1. -> Sequence[])];
minima = Flatten@Position[v, x_ /; x < .003];
width = Round@N@Mean[Differences@minima /. 1 -> Sequence[]];
centers = Round@N@Mean[minima[[{#, # + 1}]]] & /@ 
                 Flatten@Position[Differences@minima, x_ /; x > 5, Heads -> False];
lims = Round@N@{# - width/2, # + width/2} & /@ centers;
rs = Rectangle[{#[[1]], 1}, {#[[2]], Last@ImageDimensions@i}] & /@ lims
Show[i, Graphics[{Thick, Orange, Line@lines1, Yellow, Opacity[.5], rs}]]

Mathematica graphics

Dr. belisarius
  • 115,881
  • 13
  • 203
  • 453