About Rotate
Rotate is a quite strightforward function; it does what you want.
You use Rotate on something that is not a Graphics primitive? No problem, it will give what you ask:
Rotate[longvariablename, Pi/2]

More formally it performs context sensitive typesetting:
ToBoxes @ Graphics @ Rotate[Disk[], Pi]
ToBoxes @ Rotate[Disk[], Pi]
GraphicsBox[
     GeometricTransformationBox[ DiskBox[{0, 0}], {{{-1, 0}, {0, -1}}, Center}]
]
RotationBox[
    RowBox[{"Disk", "[", RowBox[{"{", RowBox[{"0", ",", "0"}], "}"}], "]"}],
    BoxRotation -> 3.14159
]
Moreover, Rotate/GeometricTransformation can't be used directly with Graphics, only with graphics primitives, that is why you get an error. You result produces something which can be boiled down to:
Graphics[{Graphics[Disk[]]}]
Your case
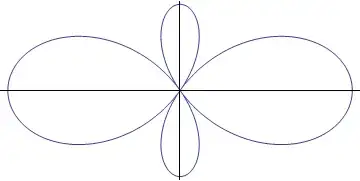
Y20 is not a graphics primitive so it will be treated as above. So you see you can't pass it to Show. It's no longer just Graphics (RotationBox is created - more at the end...).
Solution
So what to do? We have to take graphics primitives from Y20, Rotate them and put back into Graphics.
You can read for example How to examine structure of graphics to learn more but usually it is simple; for example, Plots and friends (with exclusion of Graphs) are producing:
 Graphics[{primitives..}, options..] (*or, for more complicated like ContourPlot*)

 Graphics[GraphicsComplex[spec...], options..] (*Normal[] can convert it back to simple form*)
for both cases first argument is what you need. Everything is an expression so it is again straightforward:
Graphics @ Rotate[First @ Y, Pi/2, {0,0}]
(*so exactly what I've said we need to do, take-rotate-put back*)
Show takes Graphics so you can combine it with whatever you want:
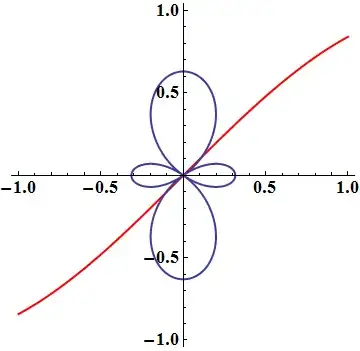
Show[{
      Plot[Sin[x], {x, -1, 1}, PlotStyle -> Red],
      Graphics[Rotate[Y20[[1]], Pi/2, {0, 0}]]},
     PlotRange -> 1, AspectRatio -> Automatic, BaseStyle -> {18, Bold, Thick}]
Keep in mind that Show, as said in documentation, takes its Options from the first argument, here Plot. It doesn't matter for this context, just pointing it out. More here
Rotate[Y20, Pi/2]? – Kuba Mar 25 '14 at 21:47Showbe needed? – Sjoerd C. de Vries Mar 25 '14 at 22:10Graphic? – Andy Mobley Mar 25 '14 at 22:12Graphics[Rotate[Y20[[1]], Pi/2, {0, 0}]]may be used inShow. – Kuba Mar 25 '14 at 22:25Showis needed, I think your fix with an explanation of why would be useful. – Andy Mobley Mar 25 '14 at 22:34