8

Problem description: I have a list of $\{x,y\}$ pairs. I'd like to divide $x$ into equal[*] bins, say $bx_1, bx_2, \ldots$, calculate $\left<y\right>$ for every bin and then plot the bin values versus the means. I.e., plot $bx_i$ versus $\left<y\right>_i$ with ListPlot[].

Question: I've already done it manually, but I was wondering whether:

  1. exists a builtin function in Mathematica that does what I want.
  2. exists a builtin function that I could use in my own implementation (e.g., HistogramList[]?).

[*] Bins with the same interval. Equally spaced intervals.


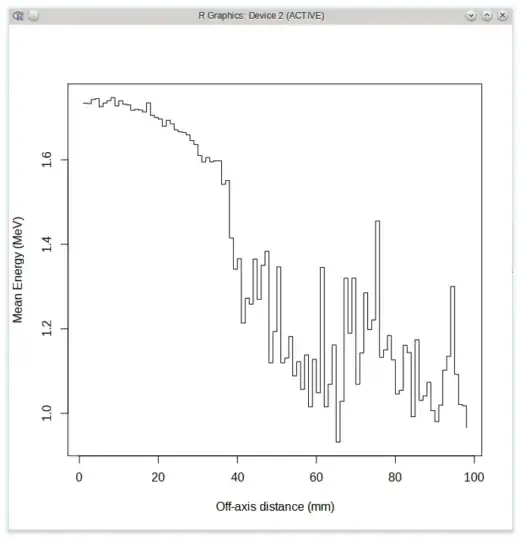
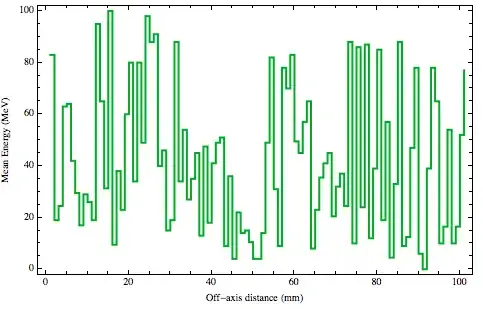
EDIT: Largely off-topic, but in R it turns out to be very easy with the fields package:

library('fields')
df <- read.table('my.dat')    # V1 -> off-axis distance, V2 -> energy
st <- stats.bin(x=df$V1, y=df$V2, N=100)
df2 <- as.data.frame(st$stats["mean",])

# Plot mean energy for every distance bin
# EDIT: Actually I should plot against `centers` of `st`, but anyway.
names(df2) <- c('mean.energy')
plot(df2$mean.energy, type="s",
    xlab="Off-axis distance (mm)", ylab="Mean Energy (MeV)")

enter image description here

stathisk
  • 3,054
  • 20
  • 37

4 Answers4

4

I'll throw this out, used it for a similar problem, since I didn't recall and simple built-in to do this:

(* test data *)
test = RandomInteger[20, {100, 2}];

(* number of bins *)
numbins = 10;

(* setup *)
{t1, t2} = Transpose@test;
{bins, bincnt} = ConstantArray[0, {2, numbins}];

{min, max} = Through[{Min, Max}[t1]];

intervals = 
  Interval/@Partition[Table[x, {x, min, max, Subtract[max, min]/numbins}], 2, 1];

binpos = (Pick[Range@numbins, IntervalMemberQ[intervals, #]] & /@ t1)[[All, 1]];

Inner[(bincnt[[#]]++; bins[[#]] += #2) &, binpos, t2];


(* results *)
Transpose[{List @@@ intervals, bins, bincnt}]
mean = bins/bincnt

(*

{{{{0, 2}}, 149, 13}, {{{2, 4}}, 133, 11}, {{{4, 6}}, 101, 9}, {{{6, 8}}, 44, 8}, 
 {{{8, 10}}, 87, 12}, {{{10, 12}}, 116, 10}, {{{12, 14}}, 127, 12}, 
 {{{14, 16}}, 80, 8} {{{16, 18}}, 83, 8}, {{{18, 20}}, 86, 9}}

{149/13, 133/11, 101/9, 11/2, 29/4, 58/5, 127/12, 10, 83/8, 86/9}

*)

Example result shows a list of lists, each with the interval, total, and count, and the mean of the bins.

ciao
  • 25,774
  • 2
  • 58
  • 139
4

Here is another option, using GatherBy, Floor and Rules.

binListsBy[data_List,binSize_,binIndex_Integer,aggrateFunctions_,nullValue_:Null]:=Module[{max,min},
    {min,max}=Floor[Through@{Min,Max}@data[[All,binIndex]],binSize];
    binListsBy[data,{min,max,binSize},binIndex,aggrateFunctions,nullValue]
]

binListsBy[data_List,{min_,max_,binSize_},binIndex_Integer,aggrateFunctions_,nullValue_:Null]:=
  Module[{intervals,findInterval,binRule},

    intervals=Partition[Range[min,max+binSize,binSize],2,1];
    findInterval={Floor[#,binSize],Floor[#,binSize]+binSize}&;
    binRule=findInterval@#[[1,binIndex]] -> {findInterval@#[[1,binIndex]],aggrateFunctions@@Transpose@#}&/@GatherBy[data,findInterval[#[[binIndex]]]&];

    binRule=Dispatch@Join[binRule,{{a_,b_}:> {{a,b},nullValue}}];
    intervals/.binRule
]

test = RandomInteger[{20,100}, {100, 2}];
binedList=binListsBy[test,20,1,N@Mean[#2]/Length[#1]&,0]

{{{20,40},5.36111},{{40,60},3.18519},{{60,80},4.10938},{{80,100},6.91837},{{100,120},59.}}

Using ListPlot:

ListPlot[Transpose@{binedList[[All,1,2]],binedList[[All,-1]]}
        ,Joined->True
        ,InterpolationOrder->0
        ,Frame->True
        ,FrameLabel->{{"Mean Energy (MeV)"},{"Off-axis distance (mm)"}}
        ,PlotStyle->{Thick,Darker@Green}
]

enter image description here

Murta
  • 26,275
  • 6
  • 76
  • 166
1

This is another version which uses BinList[] as per @rasher's suggestion:

binAndMean[xdata_List, ydata_List, nbins_Integer] :=
 Module[{xbins, bins},
  xbins = Array[# &, nbins + 1, {Min@xdata, Max@xdata}];
  bins = BinLists[Transpose[{xdata, ydata}], {xbins}, {{-Infinity, +Infinity}}];
  Table[Last /@ Flatten[bins[[k]], 1] // Mean, {k, 1, Length@bins}]]

I could have made the function accept a list of {x,y} pairs, but I found this more convenient because I already have my data as separate lists.

stathisk
  • 3,054
  • 20
  • 37
0

Suppose you are extracting your tuples from a dataset, then you can do:

Mean /@ Table[Cases[Normal@myDataset[All, {#valueToBin, #valueOfBin} &], {x_ /; Round@(x/bin) == i, y_} -> {Round@(x/bin)*bin, y}, Infinity], {i, min/bin, max/bin}]

This may seem complicated, so lets break it down:

  • min and max are the smallest / largest values in valuesToBin

  • bin is the size of your bin.

  • Normal@myDataset[All, {#valueToBin, #valueOfBin} &] retrieves your list of tuples

Since we want the mean of all the values within our bin, it would be nice if we had a nested list, such that each sublist contained all the tuples of our bin.

That is where Cases comes in. Let tuples=Normal@myDataset[All, {#valueToBin, #valueOfBin} &], then

Cases[tuples, {x_ /; Round@(x/bin) == i, y_} -> {Round@(x/bin)*bin, y}, Infinity]

Uses the pattern {x_ /; Round@(x/bin) == i, y_} to find all tuples which have an x when divided by the bin (and rounded) fit the integer value, i, of that bin. The association {x_ /; Round@(x/bin) == i, y_} -> {Round@(x/bin)*bin, y} has Cases return those tuples replacing the first value with that of the bin; Infinity searches to match at any level.

We then Table this Cases over all possible i values (found between min and max). And mean then gives you the answer.

For example:

tuples = RandomInteger[{10, 100}, {1000, 2}];
min = Min@tuples[[;; , 1]];
max = Max@tuples[[;; , 1]];
bin = 10;

Mean /@ Table[
  Cases[tuples, {x_Integer /; Round@(x/bin) == i, 
     y_} -> {Round@(x/bin)*bin, y}, Infinity], {i, min/bin, max/bin}]

and done

{{10, 936/17}, {20, 7335/134}, {30, 5416/109}, {40, 6609/116}, {50, 
  5621/96}, {60, 6148/117}, {70, 5045/99}, {80, 6531/118}, {90, 2602/
  45}, {100, 1989/35}}
SumNeuron
  • 5,422
  • 19
  • 51