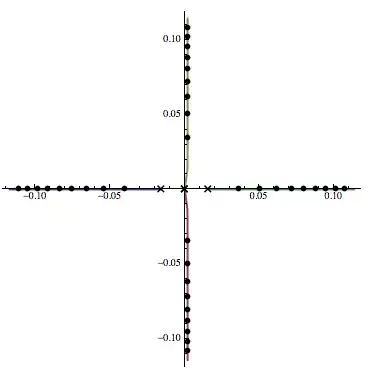
I have a polynomial equation of the fourth order, which has $4$ roots depending on a variable parameter s1. For each s1 I have $4$ solutions. I need a LinePlot of all roots to see how they move in the complex plane when the parameter s1 changes. I can solve my equation but I don't know how to plot all the roots together on one diagram (points connected with line for each solution).
poly = -6.110000000000001`*^6 k^4 + 1000.` s1^2 + 60.335263000000005`(-5.` k + s1)^2;

Table[ NSolve[ poly == 0, k], {s1, {0.1, 0.2, 0.3, 0.4, 0.5, 0.6, 0.7, 0.8, 0.9}}]