I think @rasher's comment is correct and you can plot the points you need by truncating the list. You can make a function that does that. I named mine (ironically) economicListPlot but it took a lot of copy-pasting to account for different values of the options so it could do with a tidy up
economicListPlot[data_ /; VectorQ[data], opts : OptionsPattern[ListPlot]] :=

 Module[{newopts, plotRange1, dataRange1, ind1, ind2},
  With[{
    plotRange = PlotRange /. FilterRules[{opts}, PlotRange],
    dataRange = DataRange /. FilterRules[{opts}, DataRange]
    },
   If[dataRange === DataRange,


    If[plotRange === PlotRange || plotRange === All || plotRange === Automatic,

     ListPlot[data, Evaluate[opts]],(*no plotrange or datarange defined*)

     newopts = Sequence @@ Cases[{opts}, Except[HoldPattern[PlotRange -> _]]];
     plotRange1 = If[VectorQ@plotRange, plotRange, First@plotRange];
     ind1 = IntegerPart@Max[First@plotRange1, 1];
     ind2 = IntegerPart@Max[Last@plotRange1, 1];
     ListPlot[data[[ind1 ;; ind2]],
      Evaluate@newopts,
      PlotRange -> {Automatic,
        Evaluate@
         Complement[
          plotRange, {plotRange1}]}(*plotrange defined only*)]
     ],


    If[plotRange === All || plotRange === Automatic,
     ListPlot[data, Evaluate[opts]],
     newopts = Sequence @@ Cases[{opts}, Except[HoldPattern[PlotRange -> _]]];
     newopts = Sequence @@ Cases[{newopts}, Except[HoldPattern[DataRange -> _]]];
     plotRange1 = If[VectorQ@plotRange, plotRange, First@plotRange];
     dataRange1 = If[VectorQ@dataRange, dataRange, First@dataRange];
     ind1 = Max[Ceiling[(plotRange1[[1]] - dataRange1[[1]])/
         Subtract @@ Reverse@dataRange1 (Length[data])], 1];
     ind2 = Min[Ceiling[
        ind1 + (Subtract @@ Reverse@plotRange1* (Length[data]))/
         Subtract @@ Reverse@dataRange1 ], Length[data]
       ];
     ListPlot[data[[ind1 ;; ind2]], Evaluate@newopts,
      PlotRange -> {All,
        Evaluate@Complement[ plotRange, {plotRange1}]},
      DataRange ->
       Evaluate@
        plotRange1](*both plotrange and datarange defined*)
     ]
    ]
   ]
  ]
Anyhow, it does what you want:
    data = Table[Sin[t], {t, 0, 100, 0.1}];
p = ListPlot[data, PlotRange -> {{0., 0.1}, All}, DataRange -> {0, 1},
    Joined -> True];
p2 = economicListPlot[data, PlotRange -> {{0., 0.1}, All},
   DataRange -> {0, 1}, Joined -> True];

p2[[1, 2, 1, 3, 3, 1]] // Dimensions
(*{102 , 2}*)

p[[1, 2, 1, 3, 3, 1]] // Dimensions
(*{1001 , 2}*)
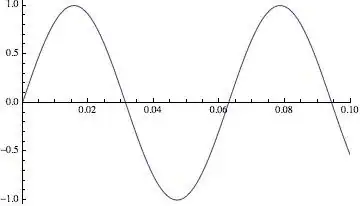
and the plots are the "same":
GraphicsRow[{p, p2}]
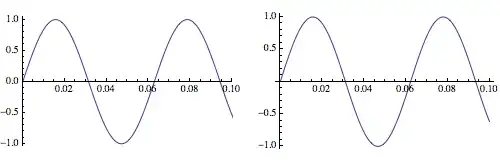
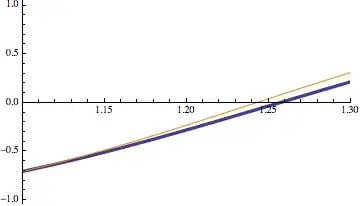
but if you go to wider plot/data ranges there is some difference (my index gymnastics are a little off) so I'd be cautious on how I'd use this:
Show[ListPlot[data, Joined -> True, PlotRange -> {{1.1, 1.3}, All},
  DataRange -> {0, 20}, PlotStyle -> Thickness[.01]],
 economicListPlot[data, Joined -> True,
  PlotRange -> {{1.1, 1.3}, All}, DataRange -> {0, 20},
  PlotStyle -> Orange]]

p[[1, 2, 1, 3, 3, 1]]to whatever you want ... – Dr. belisarius Apr 07 '14 at 21:49ls). – Silvia Apr 07 '14 at 23:58Showwith differing options from the original plot). – ciao Apr 08 '14 at 00:06ListPlotdo drop the "baggage" if we set the vertical plot range, as linked in the question? – xslittlegrass Apr 08 '14 at 02:28dt = (3.1 - (-1.2))/(100 - 1); ListPlot[Select[Transpose[{Range[-1.2, 3.1, dt], ls}], 2.1 <= #[[1]] <= 2.9 &]]. – xslittlegrass Apr 08 '14 at 05:30InterpolationFunctionthenPlotit? – Silvia Apr 08 '14 at 05:32