1

Extracting the points from a line in a ListPlot in this answer uses

points = Cases[Normal@plot, Line[pts_] :> pts, Infinity];

This works in DateListPlot (provided Joined->True) (example below, using Last to get the y-axis data only)

Clear[test,plot,points];
test={{"2010",1},{"2011",2},{"2012",3},{"2014",4},{"2015",5},{"2016",6}};
plot=DateListPlot[test,Joined->True]
points=Last/@Flatten[Cases[Normal@plot,Line[pts_]:>pts,Infinity],1]
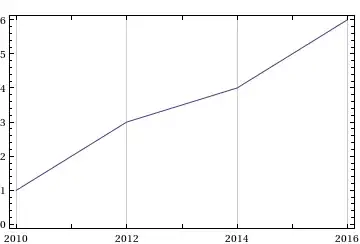
enter image description here

(*OUTPUT
{1.,2.,3.,4.,5.,6.}

However, when the plot is limited by PlotRange using date values (lower plot), the function returns the entire list of points.

plot2=DateListPlot[test,Joined->True,PlotRange->{{"2012","2015"},{0,6}}]
points2=Last/@Flatten[Cases[Normal@plot2,Line[pts_]:>pts,Infinity],1]
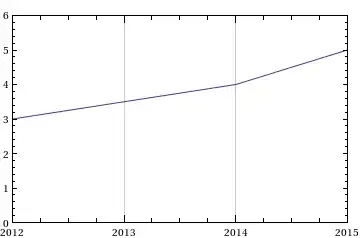
enter image description here

(*OUTPUT
{1.,2.,3.,4.,5.,6.}

Is there a function, like points which can return only the points displayed on the plot in DateListPlot under 'PlotRange` ?

PlaysDice
  • 804
  • 6
  • 11

2 Answers2

3

This should do it:

points2 = 
 With[{range = Part[PlotRange /. Options[plot2], 1]}, 
  Select[Flatten[Cases[Normal@plot2, Line[pts_] :> pts, Infinity], 1],
     First@range <= First@# && First@# <= Last@range &][[All, 2]]]

With plot2 as in your example:

{3., 4., 5.}

C. E.
  • 70,533
  • 6
  • 140
  • 264
2

A variant of Pickett's answer:

  • using new-in-10 RegionMember
  • with a terse way to extract the plot range
  • extended to either Line or Point data
  • written as a reusable function

Code:

inrangeData[gr_Graphics] := 
  Select[Rectangle @@ (PlotRange[gr]\[Transpose]) // RegionMember] /@ 
    Cases[Normal @ gr, _Point | _Line, -1][[All, 1]]

Test:

inrangeData[plot2]
{{{3.53436*10^9, 3.}, {3.59752*10^9, 4.}, {3.62906*10^9, 5.}}}
ListPlot[Prime @ Range @ 25, PlotRange -> {20, 40}]

% // inrangeData

enter image description here

{{{9., 23.}, {10., 29.}, {11., 31.}, {12., 37.}}}

The extra bracket depth is there to allow the function to handle plots with multiple lines or sets:

ListLinePlot[
  Table[{k, PDF[BinomialDistribution[50, p], k]}, {p, {0.3, 0.5, 0.8}}, {k, 0, 50}], 
  PlotRange -> {0.08, 0.15},
  Filling -> Axis
]

% // inrangeData

enter image description here

{
 {
  {11.838, 0.08}, {11.8528, 0.08035}, {12., 0.0838297}, {13., 0.105017},
  {14., 0.118948}, {15., 0.122347}, {16., 0.1147}, {17., 0.0983144},
  {17.8527, 0.08035}, {17.8693, 0.08}
 },
 {
  {22.0685, 0.08}, {22.089, 0.08035}, {23., 0.0959617}, {24., 0.107957},
  {25., 0.112275}, {26., 0.107957}, {27., 0.0959617}, {27.911, 0.08035},
  {27.9315, 0.08}
 },
 {
  {37.1629, 0.08}, {37.1755, 0.08035}, {38., 0.103275}, {39., 0.127108},
  {40., 0.139819}, {41., 0.136409}, {42., 0.116922}, {43., 0.0870116},
  {43.2105, 0.08035}, {43.2216, 0.08}
 }
}
Mr.Wizard
  • 271,378
  • 34
  • 587
  • 1,371