3

I want to plot a 2-dimensional region with constraint $x+y\le N$, i.e., I want to plot a sub-region inside a 2-simplex.

As an example:

Module[{n = 300, p = 0.5},
RegionPlot[{y > (1/2)*(n - x) && y + x <= n && y > p/(1 - p)*x}, 
{x, 0, n}, {y, 0, n}, FrameLabel -> {"x", "y"}, 
PlotStyle -> {Yellow, Opacity[0.5]}]]

What should I do to transform the region to a 2-simplex?

Edit 1 & 2 & 3

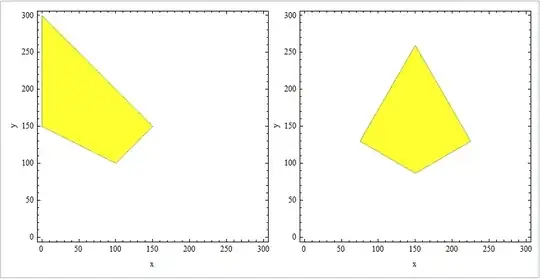
The command above will give you the following plot:

enter image description here

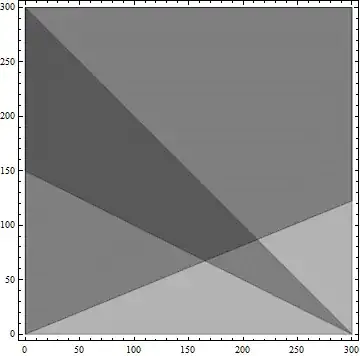
which clearly satisfies the $x+y\le N$ constraint. So I want a coordinate transform that changes the shape of the yellow area into the shape of the red area in the plot below (it is from Matlab):

enter image description here

wdg
  • 1,189
  • 9
  • 18

2 Answers2

7
rp = Module[{n = 300, p = 0.5}, 
  RegionPlot[{y > (1/2)*(n - x) && y + x <= n && y > p/(1 - p)*x},
     {x, 0, n}, {y, 0, n}, FrameLabel -> {"x", "y"}, PlotPoints -> 100,
     PlotStyle -> Directive[Yellow, Opacity[0.8]], ImageSize -> 300]];
toSimplex = #1 {1, 0} + #2 {1, Sqrt[3]}/2 &;
Panel@Row[{rp, MapAt[toSimplex @@ # &, rp, {{1, 1, ;;}}]}]

enter image description here

rp2 = Module[{n = 300, p = 0.5},  RegionPlot[{y > (1/2)*(n - x) && y + x <= n && 
    y > p/(1 - p)*x,  x + y < n}, {x, 0, n}, {y, 0, n}, FrameLabel -> {"x", "y"}, 
    PlotStyle -> {Directive[Yellow, Opacity[0.8]], Directive[White, Opacity[0.1]]},
    PlotPoints -> 100, ImageSize -> 300]];
Panel@Row[{rp2, MapAt[toSimplex @@ # &, rp2, {{1, 1, ;;}}]}]

Note: In version 9, one can use Span objects in the third argument of MapAt as first noted in this answer by Kuba.

enter image description here

You can also use

tF = FindGeometricTransform[{{0, 0}, {1, 0}, {1, Sqrt[3]}/2},
     {{0, 0}, {1, 0}, {0, 1}}][[2]];
MapAt[GeometricTransformation[#, tF] &, rp2, {1}] //Panel

enter image description here

kglr
  • 394,356
  • 18
  • 477
  • 896
0

Maybe this will be helpful:

Module[{n=300,p=0.29,r1,r2,r3,r4,x,y},
r1=y>(1/2)*(n-x);
r2=y+x<=n;
r3=y>p/(1-p)*x;
(*RegionPlot[#,{x,0,n},{y,0,n},PlotStyle\[Rule]Opacity[.3]]&/@{r1,r2,r3}*)
Show[RegionPlot[#,{x,0,n},{y,0,n},PlotStyle->Opacity[.3]]&/@{r1,r2,r3}]
]

code result

tinlyx
  • 115
  • 1
  • 6
molekyla777
  • 2,888
  • 1
  • 14
  • 28