Definitons from Planetmath
We may show that a first-degree equation
\begin{align}
Ax+By+Cz+D = 0
\end{align}
between the variables $x$, $y$, $z$ represents always a plane. In fact, we may without hurting generality suppose that, $D \leqq 0$. Now $R := \sqrt{A^2+B^2+C^2} > 0$. Thus the length of the radius vector of the point, $(A,B,C)$, is $R$. Let the angles formed by the radius vector with the positive coordinate axes be $\alpha$, $\beta$, $\gamma$. Then we can write
$$A = R\cos\alpha, \quad B = R\cos\beta, \quad C = R\cos\gamma$$
(cf. direction cosines). Dividing first degree equation term wise by $R$ gives us
$$x\cos\alpha+y\cos\beta+z\cos\gamma+\frac{D}{R} = 0,$$
where, $\frac{D}{R} \leqq 0$. The last equation represents a plane whose distance from the origin is $-\frac{D}{R}$ and whose normal line forms the angles $\alpha$, $\beta$, $\gamma$ with the coordinate axes.
Since the coefficients $A,B,C$ are proportional to the direction cosines of the normal vector of this plane, they are direction numbers of the normal line of the plane.
Examples
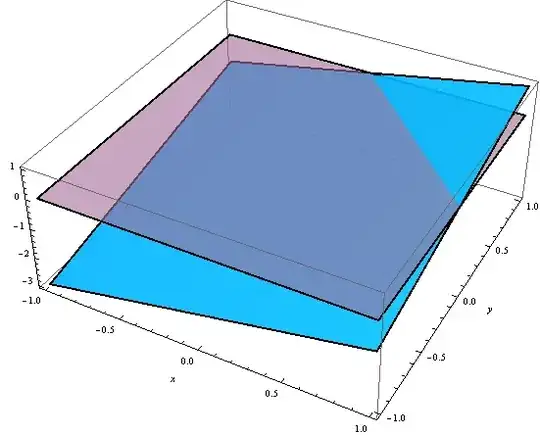
The equations of the coordinate planes are $x = 0$ ($yz$-plane); $y = 0$ ($zx$-plane), $z = 0$ ($xy$-plane); the equation of the plane through the points, $(1,0,0)$, $(0,1,0)$, and $(0,0,1)$ is $x+y+z = 1$.
Try this for $z=0$ and $x+y+z=1$.
f[x_, y_] = 0;
Plot3D[{f[x, y], x + y - 1}, {x, -1, 1}, {y, -1, 1}, Mesh -> None,AxesLabel ->
Automatic,PlotStyle -> {{Directive[Pink, Opacity[0.6],
Specularity[White, 40]]}, {Directive[Cyan, Opacity[0.9],
Specularity[White, 10]]}},BoundaryStyle -> Directive[Black, Thick]]
Your Problem
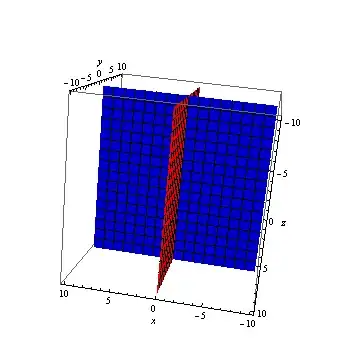
Now lets plot the plane $2 x + 2 y + z =4$ that you want with the planes $x=0,y=0$
ContourPlot3D[Evaluate@{2 x + 2 y + z == 4, {0, y, 0}, {x, 0, 0}},
{x, -1, 1}, {y, -1, 1}, {z, -1, 1},
BoundaryStyle -> Directive[Black, Thick],
MeshStyle -> Directive[Red, Thickness@0.003],
MeshFunctions -> (Total[{0, 0, #3}] &),
ColorFunction ->
Function[{x, y, z, f}, Evaluate[Hue[#] & /@ {x, y, z}]],
AxesLabel -> Automatic, Boxed -> False,
ContourStyle -> Directive[Opacity[0.6], Specularity[White, 30]],
ColorFunctionScaling -> False]

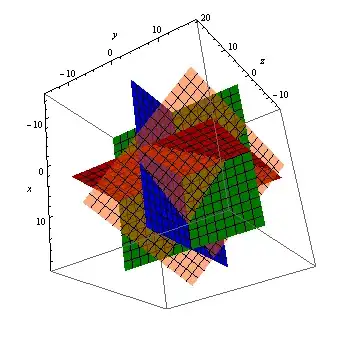
You can also use RegionPlot the see the 3D area enclosed by these three planes namely $xy,yz,zx$ that are meshed with white lines.
pic = RegionPlot3D[2 x + 2 y + z < 4, {x, -0, 1}, {y, 0, 1}, {z, 0, 8},
BoundaryStyle -> Directive[Black, Thick], Mesh -> None,
PlotStyle -> Directive[Yellow, Opacity[0.9]],
ColorFunction -> "BlueGreenYellow", AxesLabel -> Automatic,
Boxed -> False];
Show[pic, ContourPlot3D[
Evaluate@{{x, 0, 0}, {0, y, 0}, {0, 0, z}}, {x, -0, 1}, {y, 0, 1}, {z, 0, 8},
BoundaryStyle -> Directive[White, Thick],
MeshStyle -> Directive[White, Thickness@0.003],
ColorFunction -> Function[z, RGBColor[z, 1 - z, 1]],
AxesLabel -> Automatic, Boxed -> False]]


RegionPlot, see my answer. – Artes Jun 19 '12 at 10:01