10

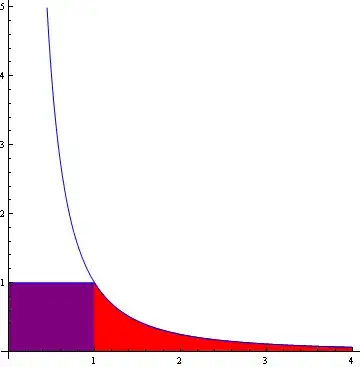
I'm trying to plot the function $f(x)=\dfrac{1}{x^2}$, filling the square area from (0,0) to (1,1) with purple and filling the area under the curve from 1 to 4 with red.

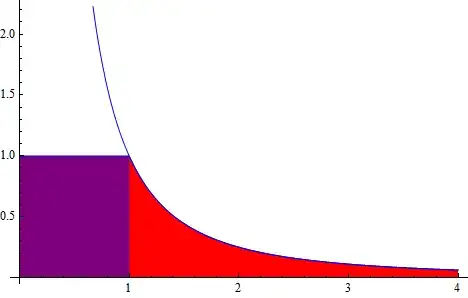
However, Mathematica is not showing the purple filling, and the red part is not completely filled down to the x-axis.

My current code:

Show[Plot[1/(x^2), {x, 0, 4}, PlotStyle -> Blue, AspectRatio -> 1],
Plot[{1/(x^2), 1}, {x, 0, 1}, PlotStyle -> Blue, Filling -> {1 -> {{2}, {Purple, None}}}],
Plot[1/(x^2), {x, 1, 4}, PlotStyle -> Blue, Filling -> Axis, FillingStyle -> Red]]

What Mathematica gives me:

What's wrong with my code?

(I'm also very new to Mathematica, so any suggestions on a more elegant way to fill the curve would be appreciated.)

Kuba
  • 136,707
  • 13
  • 279
  • 740
Eudokia
  • 103
  • 8

4 Answers4

10

One Plot can do too:

Plot[{If[x < 1, 1/(x^2)], If[x > 1, 1/(x^2)]}, {x, 0, 4}
 , AspectRatio -> 1
 , Filling -> {2 -> {Axis, Red}}
 , Epilog -> {Purple, Rectangle[]}
]

enter image description here

Kuba
  • 136,707
  • 13
  • 279
  • 740
9
Show[Plot[1/(x^2), {x, 0, 4}, PlotStyle -> Blue, AspectRatio -> 1],
 Plot[1, {x, 0, 1}, FillingStyle -> Purple, Filling -> Bottom, 
  PlotStyle -> Blue], 
 Plot[1/(x^2), {x, 1, 4}, PlotStyle -> Blue, Filling -> Axis, 
  FillingStyle -> Red, PlotRange -> {Full, {0, 1}}]]

enter image description here

ciao
  • 25,774
  • 2
  • 58
  • 139
8

Another variation, using ConditionalExpression:

Plot[{
  ConditionalExpression[x^-2, x <= 1],
  ConditionalExpression[x^-2, x > 1],
  ConditionalExpression[1, x <= 1]}
 , {x, 0, 4}, PlotStyle -> Blue,
 Filling -> {2 -> {Axis, Red}, 3 -> {Axis, Purple}}]

enter image description here

Simon Woods
  • 84,945
  • 8
  • 175
  • 324
4
Plot[{x^-2, UnitStep[1 - x], Boole[x > 1] x^-2}, {x, 0, 4}, PlotStyle -> Blue, 
      Filling -> {3 -> {{2}, {Purple, Red}}}]

enter image description here

kglr
  • 394,356
  • 18
  • 477
  • 896