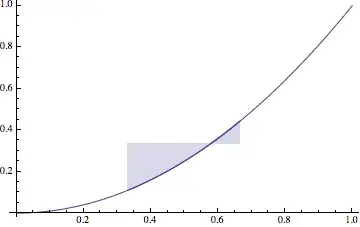
I would like to shade the area between a function, and a line, but only over a specific range. This range is smaller than the range of the entire plot. The example code and plot below make my goal more clear.
R4 = 8.3144621;(*m^3 Pa K^-1mol^-1 *)
pvDw[T_, V_, Rr_, a_, b_] =
p /. Solve[(p + a/V^2) (V - b) == Rr T, p] // First

aAr = 0.1355; (*a*)
bAr = .000032;(*b*)
TAr = 130;
guesspv = 2.6*10^6;
Show[Plot[
  Evaluate[pvDw[TAr, Vm, R4, aAr,
    bAr], {Vm, (3.2*10^-5), (1.0*10^-3)}],
  PlotStyle -> {Thick, Black}, PlotRange -> Automatic,
  Filling -> {1 -> {guesspv, Yellow}}]]
This code generates this figure

I would like to be able to show the shading only in the 2nd and third regions not the first and fouth. How would I go about doing this?
I realize that using the Filling option may not be the best way to do this also, so I am open to hearing about other options, plot types ect. I used Filling in the title because that is what I am using in my flawed solution.