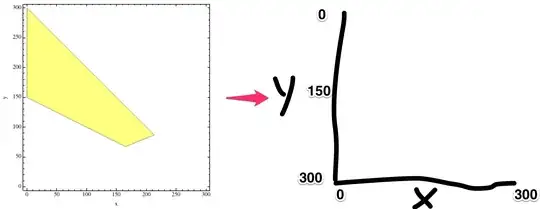
1. If you need to change just the tick labels you can use FrameTicks as follows:
rp1 = Module[{n = 300, p = 0.29},
   RegionPlot[{y > (1/2)*(n - x) && y + x <= n && y > p/(1 - p)*x}, {x, 0, n}, {y, n, 0},
    FrameLabel -> {"x", "y"},  PlotStyle -> {Directive[Yellow, Opacity[0.5]]},
    FrameTicks -> {{{#, ToString[300 - #]} & /@ Range[0, 300, 50], None}, {All, None}}]]

2. If you need to change the region polygon too, you can simply change all ys to (n-y) in the first argument of RegionPlot:
 rp2 = Module[{n = 300, p = 0.29},
    RegionPlot[{(n - y) > (1/2)*(n - x) && (n - y) + x <= n && (n - y) >
      p/(1 - p)*x}, {x, 0, n}, {y, n, 0}, FrameLabel -> {"x", "y"},
   PlotStyle -> {Directive[Yellow, Opacity[0.5]]},
   FrameTicks -> {{{#, ToString[300 - #]} & /@ Range[0, 300, 50], None}, {All, None}}]]

3. Post-processing the graphics primitives using GeometricTransformation[_,AffineTransform[_]] and the options using ReplaceAll:
rp = Module[{n = 300, p = 0.29},
RegionPlot[{y > (1/2)*(n - x) && y + x <= n && y > p/(1 - p)*x}, {x, 0, n}, {y, n, 0},
    FrameLabel -> {"x", "y"},  PlotStyle -> {Directive[Yellow, Opacity[0.5]]},
    ImageSize -> 350]];
rpb = MapAt[GeometricTransformation[#, AffineTransform[{{{1, 0},{0, -1}},{0, 300}}]] &,
            rp, {1}];
ticks = MapAt[# /.{a_, b_Real, {c_, 0.}, d___} :>{a, Round[300. - b, 1], {c, 0.}, d} &,
        AbsoluteOptions[rpb, FrameTicks], {{1, 2, 2}}];
Row[{rp, rpb,
 Show[rpb, ticks, ImagePadding-> {{Automatic, Automatic}, {Automatic, 0}}]},Spacer[5]]

4. ... use this function to get the final output:

DataReversedis not even a keyword inRegionPlot. – wdg Apr 22 '14 at 09:59