1: Reversing the image in a 2D plot (ArrayPlot or MatrixPlot)
Simply use DataReversed -> True. This has the effect of flipping the image along the horizontal axis. For example:
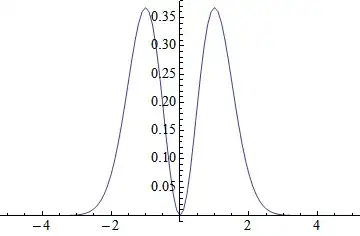
func[x_, y_] := Sinc[y ^2 + x^3];
data = Table[func[x,y], {x, -π, π, 0.1}, {y, -π, π, 0.1}];
ArrayPlot[data, DataReversed -> #] & /@ {True, False} // GraphicsRow

2: Changing the origin in a 1D plot (ListPlot or Plot)
Use AxesOrigin -> {x, y} to change the origin to where ever you like. For example:
Plot[Sin[x], {x, 0, 2 Pi}, AxesOrigin -> {0.5, 0.5}]

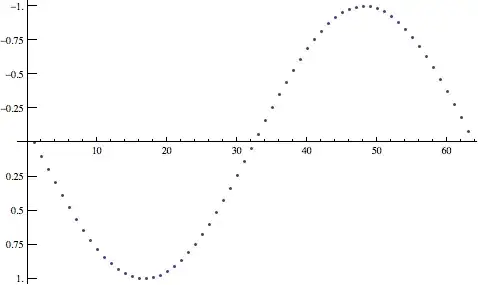
3: Changing the direction of the y-axis (or x-axis) in a 1D plot
Flipping the y-axis in a 1D plot is a bit more involved and is a very common approach in displaying depth plots. You can implement this in Mathematica by negating your input to ListPlot and assigning custom ticks with a function. Here's an example:
x = Sin /@ Range[0, 2 π, 0.1];
ListPlot[-x, Ticks -> {Automatic, Function[{xmin, xmax},
    Table[{i, -i, {0.02, 0}}, {i, N@FindDivisions[{xmin, xmax}, 10]}]]}]


ListPlot. – Emre Mar 31 '12 at 01:15ListPlotor something likeArrayPlotorMatrixPlot. If you are refering toArrayPlot/MatrixPlotthen yes, they are different, the origin is in the bottom left vs. top left. You might try making your data an image againImage@data... – s0rce Mar 31 '12 at 01:24DataReversedcould be applied toListPlotand friends (we flip the y-axis on EEG signals- tradition!!!). I've used the{#, -#2} & @@@solution in the past, theLine[args___]seems cool, but I sure wish this was just 'fixed' soDataReversed->Truewould just 'work'. Sigh. – flip Apr 03 '15 at 23:07