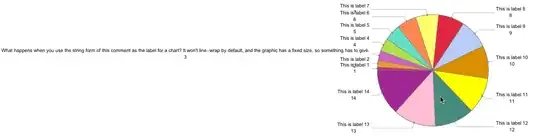
In real world usage you often want to use real world labels with long strings (say 15-20 characters) in 3D pie charts. Here is a toy example :
Clear[labeler];
labeler[datax_][v_, {1, c_}, ___] :=
  Placed[Column[{datax[[c]], v}, Alignment -> Center,
    BaseStyle -> Directive[FontFamily -> "Arial", 11]],
   "VerticalCallout"];
data = Transpose[{"This is label " <> ToString[#] & /@ Range[14],
    Range[14]}];

PieChart3D[{data[[All, 2]]},
 ChartElementFunction ->
  ChartElementDataFunction["ProfileSector3D", "Profile" -> 4],
 ChartStyle -> 54,
 ImageSize -> 400,
 LabelingFunction -> labeler[data[[All, 1]]],
 PerformanceGoal -> "Speed",
 PlotRange -> All,
 SectorOrigin -> {Pi, 0},
 SectorSpacing -> 0.2]

We see that the plot area seems to have been determined without reference to the labels that will be placed around the chart. Consequently the labels are cut off.
Q. Is this an Image Padding issue?
A. no (note that All gives the same output as Full)

Q. So why not expand the margins around the image to give the labels enough space to be rendered?

So increasing the image margins merely creates another graphics area around the original image.
This looks like a bug or design flaw to me. Does anyone have any ideas about how to get VerticalCallout labels working in PieChart3D?
ImagePaddingto 100 works for me with your example. Also, possible duplicate ;-) – ciao Apr 22 '14 at 02:05ImagePadding->Allshould adjust to include the labels. i.e. you should not have to set a value for each specific chart. Having said that, the manual value forImagePaddingdoes provide a work around. – Mike Honeychurch Apr 22 '14 at 03:01ViewPoint -> 1.4 {0, -2.4, 2}. (That vector is the default forPieChart3D.) Possible feature suggestion for WRI? "MakeGraphic3Det al smart enough to scaleViewPointto account for labels" or something to that effect? – William Apr 22 '14 at 04:06