7

Bug introduced in 10.0.0 or earlier and persisting through 10.0.0 or later


I was testing version 10 to see if the ImagePadding bug described here had been fixed and came across a significant issue. The chart (code from linked question) took "forever" to render. AbsoluteTiming wrapped around the code kept telling me the timing was ~0.3sec. However the cell bracket remained "active" for ages -- a little after a minute the cell bracket went "inactive" and the chart was rendered in output (I used a stopwatch since the built in timing functions were not capturing the real world delay):

enter image description here

After experimenting it seems that the problem was arising from ChartElementFunction -> ChartElementDataFunction["ProfileSector3D", "Profile" -> 4]

PieChart3D[{data[[All, 2]]}, 
 ChartElementFunction -> 
  ChartElementDataFunction["ProfileSector3D", "Profile" -> 4], 
 ChartStyle -> 54, ImageSize -> 400, ImagePadding -> All, 
 LabelingFunction -> labeler[data[[All, 1]]], 
 PerformanceGoal -> "Speed", PlotRange -> All, 
 SectorOrigin -> {Pi, 0}, SectorSpacing -> 0.2]

Further testing showed this problem to occur only when both ChartElementFunction and SectorOrigin where present as options as you can see in the grab below:

enter image description here

However the examples in the docs for ChartElementFunction rendered ok -- but these have SectorOrigin -> {Automatic, 1}. So it seems that it is the first position in the SectorOrigin list that is the culprit (but only when combined with this ChartElementFunction ...I haven't tested other types of ChartElementFunction ...yet).

I am running V10.0.0.5098698 on OS X 10.9.4

enter image description here

It appears others are having no problems on both Mac and Windows. Further monitoring shows the CPU load rising quite dramatically as the front end begins to crap itself:

enter image description here

enter image description here

enter image description here

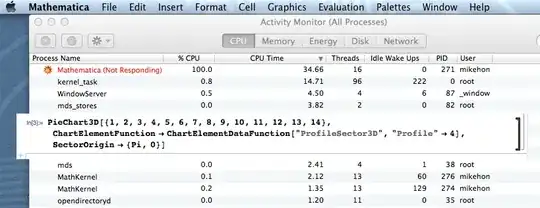
The above was after a restart. The CPU time elapsed (~ 1 minute) is indicative of how long it took for the output to be rendered. When I close V10 and run the same code in V9 output is "instantaneous."

Also even when the chart is rendered this is not the end of the problem. As soon as the cursor is over the rendered chart the front end freezes again -- CPU usage goes to 100%.

There is nothing in the underlying box code to indicate what the problem may be. Comparing V9 to V10 I notice that EdgeForm[GrayLevel[0.5]] in V9 output has been replaced by EdgeForm[{GrayLevel[0],Opacity[0.1]}] in V10 output, however this replacement occurs in both the working version in 10 (the first example below) and the freezing version. So that doesn't appear to be the issue.

Some test input:

This should work ok:

PieChart3D[{1, 2, 3, 4, 5, 6, 7, 8, 9, 10, 11, 12, 13, 14}, 
 ChartElementFunction -> 
  ChartElementDataFunction["ProfileSector3D", "Profile" -> 4], 
 SectorOrigin -> {Automatic, 0}]

This next example should take a minute (literally) to render (WARNING. save your work. If you evaluate this >2 times the front end might soil its pants and crash):

PieChart3D[{1, 2, 3, 4, 5, 6, 7, 8, 9, 10, 11, 12, 13, 14}, 
 ChartElementFunction -> 
  ChartElementDataFunction["ProfileSector3D", "Profile" -> 4], 
 SectorOrigin -> {Pi, 0}]

Update

Szabolcs sent me a notebook in which he'd rendered the pie chart. The notebook opened instanteously but as soon as I placed the mouse over the pie chart the front end crapped itself.

Mike Honeychurch
  • 37,541
  • 3
  • 85
  • 158
  • I just tried it in Windows 8.1, it was instantaneous. No problems. – RunnyKine Jul 16 '14 at 03:50
  • I have no problems with MMA 10 on OS X 10.8.5 - so maybe it's specific to Mavericks. Can't test on 10.9.4 because I didn't upgrade. – Jens Jul 16 '14 at 04:11
  • @Jens interesting. My other Mac is 32 bit so cannot test on that. I have restarted the computer and retested but the problem persists. – Mike Honeychurch Jul 16 '14 at 04:13
  • I'm running Mathematica 10 on Mac OS X 10.9.4 (64-bit) and I'm afraid I do not see this problem... –  Jul 16 '14 at 04:17
  • @RahulNarain really??!!! – Mike Honeychurch Jul 16 '14 at 04:22
  • I'm on 10.9.4 too. The last code block evaluates and renders in a second or so. (By "feeling", I didn't measure precisely.) Can you try these Mike? AbsoluteTiming[expr;] and AbsoluteTiming[ToBoxes[expr];] – Szabolcs Jul 16 '14 at 04:42
  • Both versions produce their expected output with V10 on OS X 10.6.8. Both are essentially instantaneous. – m_goldberg Jul 16 '14 at 04:43
  • @Szabolcs as i indicated in the question I tried AbsoluteTiming and the output was {0.3, chart} but the output only appeared a minute later! – Mike Honeychurch Jul 16 '14 at 04:54
  • @m_goldberg this is getting weird. With V9 it is instantaneous. With V10 the front end sh#*s itself. Strange that no one else is seeing this – Mike Honeychurch Jul 16 '14 at 05:02
  • Is it reliably repeatable over multiple restarts of Mathematica? Or is it sporadic? I presume you have tried multiple restarts with a clean Front End. – m_goldberg Jul 16 '14 at 05:40
  • @m_goldberg yes repeated computer restarts, mathematica restarts, clean front end etc. It is reproducible ...occurs every time as per outline in OP. Am now comparing box code in V9 vs V10 to examine differences. – Mike Honeychurch Jul 16 '14 at 05:57
  • I can reliably reproduce your problem on Mac OSX 10.9.4 in V10. Even once it's rendered there's something going on. – Cameron Murray Jul 16 '14 at 06:45
  • 1
    @CameronMurray maybe the problem only effects Australians :) – Mike Honeychurch Jul 16 '14 at 07:26
  • Is there an Australian edition of OS X different from the US edition? If so, maybe you're right about this problem only affecting Australians. – m_goldberg Jul 16 '14 at 07:35
  • @m_goldberg I was being facetious but maybe a different build was available at the time that the download became available here?? – Mike Honeychurch Jul 16 '14 at 07:39
  • 1
    Though I'm on Windows you get a +1 because I appreciate your frustration. Apparently M10 has a lot of localized bugs that are hard to reproduce. I can't believe I'm the only one suffering with this, for example. – Mr.Wizard Jul 16 '14 at 07:45
  • @Mr.Wizard yes I couldn't reproduce your issue. I can't think of anything else to try with mine. :( – Mike Honeychurch Jul 16 '14 at 07:51
  • I can think of something else - not using pie charts, aka "The Worst Charts in the World" ;) http://www.businessinsider.com.au/pie-charts-are-the-worst-2013-6 – Cameron Murray Jul 16 '14 at 12:14
  • I'm having a somewhat similar issue with V10 on Win 8.1. After doing any Plot3D/Graphics3D, if I click the output cell, the frontend freezes. It also freezes if I evaluate more than 1 Plot3D/Graphics3D. Apparently, I'm the only one to have this issue??? – david Jul 17 '14 at 03:46
  • @david very strange that this issue seems so random – Mike Honeychurch Jul 17 '14 at 04:20
  • If you know whether this has been fixed, would you update the question with that info? Thanks. (Format: http://meta.mathematica.stackexchange.com/questions/1610/standard-header-for-bugs-tagged-posts-for-easy-searching). – Michael E2 Aug 08 '15 at 18:48
  • @michaelE2 I do not know. I have used V10 much and not at all for a month. Currently on vacation – Mike Honeychurch Aug 08 '15 at 19:25

1 Answers1

2

Confirmed bug by WRI tech support

Mike Honeychurch
  • 37,541
  • 3
  • 85
  • 158
  • Tried the code in Mathematica 10.0 under Linux... same error. Processor goes to 100% for a long time every time you click on the pie chart. – cjpembo Aug 21 '14 at 18:40