21

I want to create an interpolation through the following 2dim data points:

data = {{22.78, 0.2431}, {22.06, 0.262}, {21.51, 0.2774}, {21.07, 
   0.2905}, {20.7, 0.302}, {20.38, 0.3121}, {20.1, 0.3213}, {19.86, 
   0.3296}, {19.28, 0.3499}, {5.41, 0.363}, {5.88, 0.364}, {18.71, 
   0.3709}, {5.14, 0.3715}, {5.11, 0.3734}, {6.3, 0.3772}, {6.4, 
   0.3824}, {4.96, 0.3882}, {18.15, 0.3925}, {4.9, 0.4036}, {4.89, 
   0.4083}, {6.69, 0.4141}, {17.6, 0.4147}, {4.91, 0.4372}, {17.06, 
   0.4374}, {6.61, 0.4414}, {6.43, 0.4493}, {4.98, 0.459}, {16.52, 
   0.4603}, {5.07, 0.4791}, {15.99, 0.4835}, {5.19, 0.4995}, {15.47, 
   0.5067}, {5.33, 0.5204}, {14.96, 0.5297}, {5.5, 0.5415}, {14.45, 
   0.5524}, {5.69, 0.5626}, {13.95, 0.5745}, {5.9, 0.5834}, {13.46, 
   0.5957}, {6.13, 0.6035}, {12.98, 0.6158}, {6.38, 0.6227}, {12.5, 
   0.6346}, {6.65, 0.6407}, {12.03, 0.6518}, {6.94, 0.6571}, {11.57, 
   0.6672}, {7.25, 0.6717}, {11.12, 0.6805}, {7.57, 0.6842}, {10.68, 
   0.6915}, {7.91, 0.6944}, {10.25, 0.7}, {8.27, 0.7021}, {9.83, 
   0.7059}, {8.64, 0.7072}, {9.42, 0.7091}, {9.02, 0.7095}};

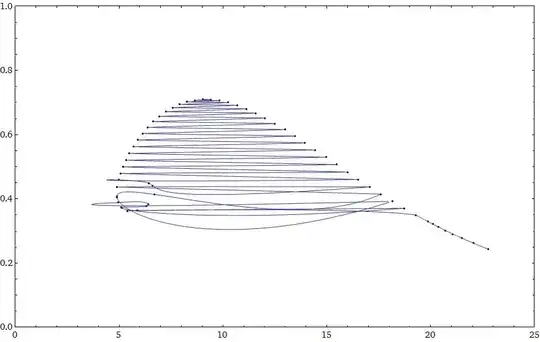
With the common interpolation the plot looks like this:

dataInt = Interpolation @ data;
Show[{
  ListPlot[data, 
    PlotRange -> {{0, 25}, {0, 1}}, ImageSize -> 800], 
  Plot[dataInt[r], {r, 5, 25}, 
    PlotStyle -> RGBColor[0, 0, 1, .5]]}]

Listplot with interpolation

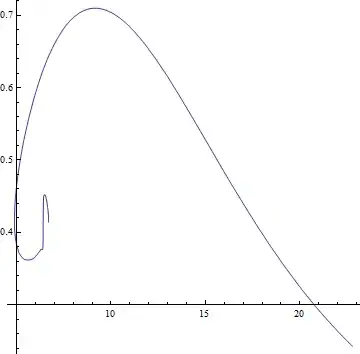
I already tried to obtain a better interpolation using Nearest or try to interpolate the two components seperatly but I was not able to get it the way I want it to be: It just does not connect the right points together. I already tried the solution presented here Parametric differentiable interpolation of a 2D data set using parametrizeCurve[] but it does not create an adequate interpolation either:

tvals = parametrizeCurve[data];
int = Interpolation[Transpose[{tvals, data}]]
Show[{
  ListPlot[data, PlotRange -> {{0, 25}, {0, 1}}, ImageSize -> 800], 
  ParametricPlot[int[t], {t, 0, 1}]}]

Interpolation with using parametrizeCurve

I must admit, that I dont understand the method behind parametrizeCurve, but it seems to be working with the wrong dimension of my data. I would be very happy to get a solution to my problem.

Martin
  • 313
  • 2
  • 5

3 Answers3

19

Edit

Applying @Kuba's y-rescaling trick works here as well, just pass the rescaling through the DistanceFunction option

tour2 = FindShortestTour[data, 
   DistanceFunction -> (EuclideanDistance[#1 {1, 30},  #2 {1, 30}] &)];
ListLinePlot[data[[tour2[[2]]]], 
 Epilog -> {PointSize@0.01, Red, Point /@ data}]

Mathematica graphics


Here's as close as I can come with your set of data. I found a reasonable solution with FindShortestTour

tour = FindShortestTour[data]
ListLinePlot[data[[tour[[2]]]], 
 Epilog -> {PointSize@0.01, Red, Point /@ data}]

Mathematica graphics

We can now make an interpolating (parametric) dataset

Table[{i, data[[tour[[2, i]]]]}, {i, Length@data}];
points = Interpolation[%]
ParametricPlot[points[t], {t, 1, 59}, AspectRatio -> 1]

Mathematica graphics

bobthechemist
  • 19,693
  • 4
  • 52
  • 138
  • Hey! The distance trick is nice! I wonder if we can set up a local distance (using some density measurement on each axis) so that the thing could be automated and put to work in almost any situation. – Dr. belisarius May 05 '14 at 22:58
  • I used the solution using FindShortestTour[data], which worked fine for me. I avoided those little artifacts at the left end of the curve by putting in more data, which I could gernate quite easily. The parametric interpolating of data using tour is exacly what I needed. – Martin May 06 '14 at 14:00
15

After reading the above answers, I see the the whole thing can be reduced to just three lines of code.

path = First @ FindCurvePath @ Standardize @ data
curve = Interpolation @ MapIndexed[{#2[[1]], #1} &, data[[path]]];
ParametricPlot[curve[t], {t, 1, 59}, AspectRatio -> 3/4]

plot

Nice work guys!

m_goldberg
  • 107,779
  • 16
  • 103
  • 257
12

As Rahul Narain has pointed, FindCurvePath is the way to go. However, we need to give it some feedback. The problem is that points x-y scales are different about 20x. With quick fix, it is working.

I'm multiplying each pair with {1, 10} but a neat solution is to use Standardize@data as Simon Woods has noticed.

ord = FindCurvePath[# {1, 10} & /@ data]

Graphics[Line@data[[ord[[1]]]], AspectRatio -> 1]

enter image description here


The following works because points are quite dense:

dat = # {1, 10} & /@ SortBy[data, -#[[1]] &];
a = First@dat;
b = Rest@dat;
path = {1, .1} # & /@ First@Last@Reap@Do[
       b = DeleteCases[b, a = Sow@Nearest[b, a][[1]], 1];,
       {Length@b}];

Graphics[Line@path, AspectRatio -> 1, Frame -> True]

enter image description here

Kuba
  • 136,707
  • 13
  • 279
  • 740