I know that Mathematica has built-in functions for creating triangulations and Voronoi diagrams. However, I haven't found a function that would create a Voronoi diagram for line segments. Is there a nice hack for it? Or should I rather write a function myself, or use some C/C++ library like CGAL to import such a function?
Asked
Active
Viewed 608 times
6
-
6Have you seen this? – RunnyKine May 06 '14 at 06:54
2 Answers
14
This answer took a bit longer to write than I'd like, due to some unexpected complications, which will soon be apparent.
In version 8, faking a Voronoi diagram with Nearest[] is easy, because Nearest[] has the surprising feature that it supports "unsymmetric" distance functions. For this situation, we need the usual way to compute the point-segment distance:
PointSegmentDistance[{x_, y_}, {{x1_, y1_}, {x2_, y2_}}] :=
     With[{sv = {x, y} - {x1, y1}, sp = {x2, y2} - {x1, y1}},
          EuclideanDistance[sv, Clip[sp.sv/sp.sp, {0, 1}] sp]]
Let me proceed with a concrete example. I'll use the method here to generate a pile of non-intersecting lines:
Graphics`Mesh`MeshInit[];
BlockRandom[SeedRandom[1023, Method -> "ExtendedCA"];
            n = 8; k = 1; lines = {RandomReal[1, {2, 2}]};
            While[k < n, test = RandomReal[1, {2, 2}];
                  If[FindIntersections[{Line[lines], Line[test]}] === {},
                     k++; AppendTo[lines, test]]];]
Now, generate a NearestFunction[]:
nf = Nearest[lines, DistanceFunction -> PointSegmentDistance];
At this juncture, we can proceed in a manner similar to this answer, using Schlick's "bias" function:
bias[a_, t_] := t/((1/a - 2) (1 - t) + 1)
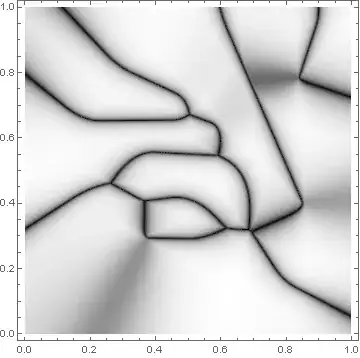
DensityPlot[bias[0.99, #2 - #1] & @@ (PointSegmentDistance[{x, y}, #] & /@ nf[{x, y}, 2]),
{x, 0, 1}, {y, 0, 1}, AspectRatio -> Automatic, ColorFunction -> GrayLevel,
PlotPoints -> 105, PlotRange -> All]

In (apparently) versions 10 and above, however, Nearest[] seems to have been redesigned in a manner that no longer supports unsymmetric distance functions. Thus, the slower approach of having to check each line segment is necessary:
DensityPlot[bias[0.99, #2 - #1] & @@
            TakeSmallest[PointSegmentDistance[{x, y}, #] & /@ lines, 2],
            {x, 0, 1}, {y, 0, 1}, AspectRatio -> Automatic, ColorFunction -> GrayLevel,
            PlotPoints -> 105, PlotRange -> All]
J. M.'s missing motivation
- 124,525
- 11
- 401
- 574
-
Nice work.And I hope the OP have not forgot this question after three years. :) – yode Apr 18 '17 at 17:12
3
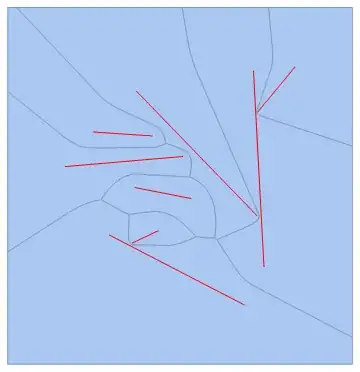
The method featured in Okabe et al.'s "Spatial Tessellations", which I had used here, can also be used for this case.
Using the same definition of lines in my other answer, we can proceed like so:
n = 20; (* number of divisions for shortest line segment *)
divs = Ceiling[n Normalize[EuclideanDistance @@@ lines, Min]];

pp = MapThread[With[{s = Subdivide[0, 1, #2]}, Transpose[{1 - s, s}].#1] &, {lines, divs}];

vm = VoronoiMesh[Flatten[pp, 1]];
facs = MeshPrimitives[vm, 2]; cif = Region`Mesh`MeshMemberCellIndex[vm];

DiscretizeGraphics[Graphics[Graphics`PolygonUtils`PolygonCombine[facs[[#]]] & /@
                   Internal`PartitionRagged[cif[Flatten[pp, 1]][[All, -1]], Length /@ pp]]]

Show the diagram along with the generating line segments:
Show[%, Graphics[{Red, Line[lines]}]]
J. M.'s missing motivation
- 124,525
- 11
- 401
- 574