4

I have a list of city names (of arbitrary length), f.e.

c = {"BAL", "NYC", "LAS", "AUS"};

and the distances between them :

d = {232, 318, 467, 285, 670, 530};

With

m = (Flatten /@ Transpose[{c, DiagonalMatrix@Table["x", {Length@c}]}])~Prepend~({""}~Join~c)

I get:

enter image description here

Now, misusing Mathematica as a typewriter:

m[[2, 3]] = d[[1]];
m[[2, 4]] = d[[2]];
m[[2, 5]] = d[[3]];
m[[3, 2]] = d[[1]];
m[[3, 4]] = d[[5]];
m[[3, 5]] = d[[6]];
m[[4, 2]] = d[[2]];
(* etc. *)

I get:

enter image description here

1st question: How can I automate this?

2nd question: How can I get a graph of these distances?

Thank you in advance for any help

eldo
  • 67,911
  • 5
  • 60
  • 168
  • How are cities and distances correlated? – Yves Klett May 31 '14 at 14:25
  • 1
    @YvesKlett - The correlation is 1->2, 1->3, 1->4, 2->3, 2->4 and 3->4 – eldo May 31 '14 at 14:28
  • 1
    Reminds me of this: http://codereview.stackexchange.com/questions/5307/fill-upper-triangular-matrix-from-a-list – Szabolcs May 31 '14 at 14:30
  • 1
    Also this: http://mathematica.stackexchange.com/q/7511/12 – Szabolcs May 31 '14 at 14:32
  • 1
    Depending on the application, you might consider storing the coordinates of the cities instead and defining a metric (distance function) that takes two sets of coordinates and spits out the distance.

    i.e. if you're looking literally at the bird's eye distance between cities, you could store the latitude/longitude of the cities and use a function to calculate the distances from there and fill in the table.

    – Myridium May 31 '14 at 14:33
  • Do you always supply the distances or do you want to get them elsewhere? If you were supplying a full distance matrix, the rest would be trivial. – Yves Klett May 31 '14 at 14:44
  • @YvesKlett - I always have (start with) c and d and I also know the correlation (like above). So, my only problem is: how can I bring the distances in the grid. – eldo May 31 '14 at 14:50
  • So BAL->NYC != NYC->BAL etc.? And why not a zero on the diagonal? – Yves Klett May 31 '14 at 14:58
  • @YvesKlett - No, The distance between New York and Baltimore should be equal to the distance between Baltimore and New York. – eldo May 31 '14 at 15:02
  • 1
    The matrix you've entered manually does not match up with the city-distance correlation you've stated above. – Myridium May 31 '14 at 15:03
  • @Myridium - BAL->NYC (1->2) = 232, BAL->LAS (1->3) = 318 ... LAS->AUS (3->4) = 530. What do I overlook here? – eldo May 31 '14 at 15:09
  • Look at your second image, it says BAL->NYC =232, but NYC->BAL=285 – dr.blochwave May 31 '14 at 15:14
  • @blochwave - sorry, that was a typing error - I have corrected the question – eldo May 31 '14 at 15:20

8 Answers8

8
d = {232, 318, 467, 285, 670, 530};
c = {"BAL", "NYC", "LAS", "AUS"};

Assuming that the n(n-1)/2 elements in the distance list d correspond to the upper triangular part of the distance matrix for the given ordering of the cities, let

sA = SparseArray[Thread[Subsets[Range[Length@c], {2}] -> d], {Length@c, Length@c}];


sA // Normal // TableForm[#, TableHeadings -> {c, c}] &

enter image description here

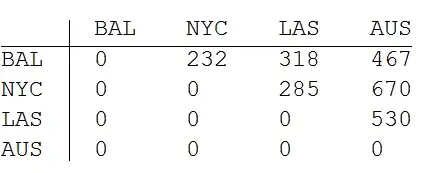
To get the full matrix just add sA and its transpose:

sA + sA\[Transpose] // Normal // TableForm[#, TableHeadings -> {c, c}] &

enter image description here

Using WeightedAdjacencyGraph with coordinates based on multi-dimensional scaling:

I use a modification of the code from this Demonstration to get the vertex coordinates that respect the distances in our distance matrix:

ClearAll[mDS]; 
mDS[dm_] := Module[{dims = Dimensions[dm], em = - dm dm/2, ctr, 
                    vsdvF = #[[1]].Sqrt[#[[2]]].Transpose[#[[1]]] &}, 
              ctr = IdentityMatrix[dims[[1]]] - ConstantArray[1/dims[[1]], dims]; 
             N@Transpose[vsdvF@SingularValueDecomposition[ctr.em.ctr]][[All, ;; 2]]];

dm = sA + sA\[Transpose];
vcoords = mDS[dm];
scldcoords = Transpose[Rescale /@ Transpose@vcoords];
dm = (Normal[dm]) /. (0) -> Infinity; 

options = {VertexShapeFunction -> "Square", VertexSize -> {16, 8}, 
           VertexLabels -> Placed["Name", Center], 
           VertexStyle -> Hue[0.1, 0.5, 1.], AspectRatio->1,
           VertexLabelStyle -> Directive[FontFamily -> "Arial", 16], 
           ImageSize -> 380, ImagePadding -> 20, DirectedEdges -> True,
           EdgeStyle -> Directive[Thick, Blue, Arrowheads[{{.05, .75}}]]}; 

WeightedAdjacencyGraph[c, dm, options, VertexCoordinates -> scldcoords]

enter image description here

... and using actual coordinates from CityData:

 cities = {{"Baltimore", "Maryland", "UnitedStates"}, 
           {"NewYork",  "NewYork", "UnitedStates"}, 
           {"LasVegas", "Nevada",  "UnitedStates"},
           {"Austin", "Texas", "UnitedStates"}};
 vcoords2 = Reverse@CityData[#, "Coordinates"] & /@ cities;
 scldcoords2 = Transpose[Rescale /@ Transpose@vcoords2];

 WeightedAdjacencyGraph[c, dm, options, VertexCoordinates -> scldcoords2]

enter image description here

kglr
  • 394,356
  • 18
  • 477
  • 896
5

Since other methods are already taken:

c = {"BAL", "NYC", "LAS", "AUS"};
d = {232, 318, 467, 285, 670, 530};

n = Length@c;

max = Binomial[n, 2];

f1 = FoldList[Subtract, max, #] &;

m = MapThread[d[[# ;; #2]] &, f1 /@ Range[{2, 1}, n - {1, 2}]] // Reverse;
m = ArrayPad[PadLeft[#, n] & /@ m, {{0, 1}, 0}];
m + m\[Transpose] // MatrixForm

So much for terse coding, but hopefully it's reasonably efficient. :^)

Mr.Wizard
  • 271,378
  • 34
  • 587
  • 1,371
  • @ Mr.Wizard - Thank you very much. Your "Binomial" is very useful for me when I want to test whether the two initial lists "match". It also answers - quite unexpectedly - another of my beginner-questions: How to map an anonymous functions to another anonymous function ( f1, m) when slots are already "occupied". – eldo May 31 '14 at 20:42
4

Another way, showcasing Internal`PartitionRagged:

upper = Join[
  PadLeft[#, Length[c]] & /@ 
   Internal`PartitionRagged[d, Reverse@Range[Length[c] - 1]],
  {ConstantArray[0, Length[c]]}
  ];
upper + Transpose@upper // TableForm
C. E.
  • 70,533
  • 6
  • 140
  • 264
2

Using GroupBy and Dataset as display function:

d = {232, 318, 467, 285, 670, 530};
c = {"BAL", "NYC", "LAS", "AUS"};

table = Join[#, MapAt[Reverse, #, {All, 1}]] & [Thread[{Subsets[c, {2}], d}]];

I borrowed the following two lines from @Edmund

(Analyzing football games (pairing matrix))

zeros = Join[table, {{#, #}, 0} & /@ c];

result = KeySort @ Map[KeySort] @ GroupBy[zeros, {First @* First, Last @* First -> Last}, First];

result // Dataset

enter image description here

eldo
  • 67,911
  • 5
  • 60
  • 168
2

Not exactly sure as how the rule extends to other examples, but this replicates your matrix

c = {"BAL", "NYC", "LAS", "AUS"}; 
d = {232, 318, 467, 285, 670, 530};
e = Flatten@Table[d[[j]], {i, 1, Length@c}, {j, i, Length@d}];
k = 0; Table[
 If[i == j || k >= 2 Length@c - 1, 0, k = k + 1; e[[k]]], {i, 
  Length@c}, {j, Length@c}]

(*{{0, 232, 318, 467}, {285, 0, 670, 530}, {318, 0, 0, 0}, {0, 0, 0, 0}}*)
Zviovich
  • 9,308
  • 1
  • 30
  • 52
2

Sorry I don't have time to answer this thoroughly, but observe:

d = {232, 318, 467, 285, 670, 530};

DistMatrix[d_, NumCities_] := Block[{i, l},
   Return[(# + Transpose@#) &[
      Append[
       Normal@SparseArray[
         Flatten[Table[
            Table[{i, l + i}, {l, 1, NumCities - i}], {i, 1, 
             NumCities - 1}], 1] -> d]
       , Table[0, {NumCities}]]]
     ];
   ];

DistMatrix[d,4]
{{0, 232, 318, 467}, {232, 0, 285, 670}, {318, 285, 0, 530}, {467, 670, 530, 0}}

This is the same as the desired matrix if you view it in TraditionalForm.

Myridium
  • 1,089
  • 5
  • 15
2
c = {"Baltimore", "New York", "Las Vegas", "Austin"};

n = Length[c];

pos = Flatten[
   Table[{i, j}, {i, n - 1}, {j, i + 1, n}],
   1];

d = ToExpression[
    StringDrop[
     WolframAlpha[
      "distance between " <> #[[1]] <> 
       " and " <> #[[2]], {{"Result", 1}, 
       "Plaintext"}], -6]] & /@
   (c[[#]] & /@ pos)

{170.2, 2111, 1348, 2242, 1514, 1091}

m = Module[{mat, pts},
   mat = ConstantArray[0, {n, n}];
   ReplacePart[mat, Join[
     Thread[pos -> d],
     Thread[(Reverse /@ pos) -> d]]]];

TableForm[m, TableHeadings -> {c, c}]

WolframAlpha[
 "plot of " <> StringJoin[Riffle[c, ", "]],
 {{"Path:CityData", 1}, "Content"}]
Mr.Wizard
  • 271,378
  • 34
  • 587
  • 1,371
Bob Hanlon
  • 157,611
  • 7
  • 77
  • 198
  • This throws several ToExpression::sntxi: Incomplete expression; more input is needed . messages here and mainly fills the table with $Failed. – Yves Klett May 31 '14 at 21:58
  • @YvesKlett - Same with me – eldo May 31 '14 at 22:52
  • Code works in version 9.0.1 on my Mac – Bob Hanlon Jun 01 '14 at 01:25
  • For some reason, on Win7 64bit and 9.01 the StringDrop part mangles the W|A output. A working alternative is: d = StringSplit[ StringDrop[ WolframAlpha[ "distance between " <> #[[1]] <> " and " <> #[[2]], {{"Result", 1}, "Plaintext"}], 0]][[1]] & /@ (c[[#]] & /@ pos) – Yves Klett Jun 01 '14 at 11:56
1

Using ReplaceList:

d = {232, 318, 467, 285, 670, 530}; 
c = {"BAL", "NYC", "LAS", "AUS"};

lut = First /@ PositionIndex[c]

<|"BAL" -> 1, "NYC" -> 2, "LAS" -> 3, "AUS" -> 4|>

d2 = Thread[ReplaceList[c, {___, x_, y__, ___} :> {x, Last@{y}}] -> d];

d3 = Thread[ReplaceList[c, {___, x_, y__, ___} :> {Last@{y}, x}] -> d];

dm = Join[d2, d3] /. lut // SparseArray // Normal

dm // TableForm[#, TableHeadings -> {c, c}] &

enter image description here

Syed
  • 52,495
  • 4
  • 30
  • 85