I want to plot data with very small differences. I can't see the differences in my plot:
data = {4.60001, 4.60002, 4.60003, 4.60004}

ListPlot[data, Joined -> True, AxesOrigin -> {1, 1}]

ListPlot[data, Joined -> True]
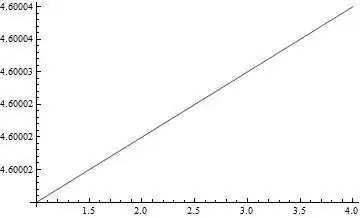
Your definition of AxesOrigin was the evildoer
Your Data are plotting just fine;
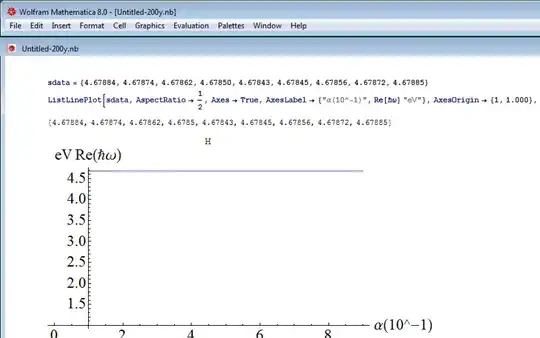
sdata = {4.67884, 4.67874, 4.67862, 4.67850, 4.67843, 4.67845, 4.67856, 4.67872, 4.67885};
Compare the two plots p1 and p2;
p1 = ListLinePlot[sdata, AxesLabel -> {"a", "b"}, AxesOrigin -> {1, 1}];
p2 = ListLinePlot[sdata, AxesLabel -> {"a", "b"}, AxesOrigin -> Automatic];
GraphicsRow[{p1, p2}, ImageSize -> 600]

You simply messing with AxesOrigin
I suspect the help Files Axes Origin and Axis will support you;
AxesOrigin is an option for graphics functions that specifies where any axes drawn should cross.
Axis is a symbol that represents the axis for purposes of alignment and positioning.
PlotRange. – Yves Klett Jun 10 '14 at 16:27