If you can put your schedule into a list like this:
schedule = {
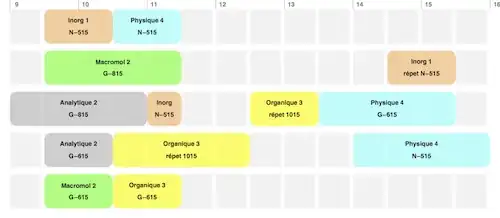
{"Lundi", "09:30", 1, "Inorg 1", "N-515", Lighter[Orange, 0.5]},
{"Lundi", "10:30", 1, "Physique 4", "N-515", Lighter[Cyan, 0.5]},
{"Mardi", "9:30", 2, "Macromol 2", "G-815", Lighter[Green, 0.3]},
{"Mardi", "14:30", 1, "Inorg 1", "répet N-515", Lighter[Orange, 0.5]},
{"Mecredi", "9:0", 2, "Analytique 2", "G-815", Lighter[Gray, 0.5]},
{"Mecredi", "11:00", 0.5, "Inorg", "N-515", Lighter[Orange, 0.5]},
{"Mecredi", "12:30", 1, "Organique 3", "répet 1015", Lighter[Yellow, 0.2]},
{"Mecredi", "13:30", 2, "Physique 4", "G-615", Lighter[Cyan, 0.5]},
{"Jeudi", "9:30", 1, "Analytique 2", "G-615", Lighter[Gray, 0.5]},
{"Jeudi", "10:30", 2, "Organique 3", "répet 1015", Lighter[Yellow, 0.2]},
{"Jeudi", "14:00", 2, "Physique 4", "N-515", Lighter[Cyan, 0.5]},
{"Vendredi", "09:30", 1, "Macromol 2", "G-615", Lighter[Green, 0.3]},
{"Vendredi", "10:30", 1, "Organique 3", "G-615", Lighter[Yellow, 0.2]}
};
then a Manipulate like this:
isn't too difficult to make, just fiddly in places. Unfortunately, "pretty" isn't an easy word - much gets lost in translation... :) My attempt may be more to my taste than yours...
days = {"Lundi", "Mardi", "Mecredi", "Jeudi", "Vendredi"};
timeStringToDecimal[time_] := Module[
  (* 24 hour clock, of course *)
  {hours =
    ToExpression[First[StringSplit[time, ":"]]],
    minutes = ToExpression[Last[StringSplit[time, ":"]]]},
  N[hours + (minutes / 60)]]

eventStart[time_] :=
  timeStringToDecimal[time];

eventStarts =
  With[{time = #[[2]]}, timeStringToDecimal[time]] & /@ schedule;

firstEvent = Min[eventStarts]; lastEvent = Max[eventStarts];

eventsForDay[day_] :=
  Select[schedule, #[[1]] == day &] ;

graphicsForEvent[event_, boxHeight_, opacity_, y_] := Module[
   {eventStartPoint = eventStart[event[[2]]],
    eventDuration = event[[3]],
    eventName = event[[4]],
    eventLocation = event[[5]]},
   {event[[6]],
    Opacity[opacity],
    Rectangle[{eventStartPoint, y}, {eventStartPoint + eventDuration,
      y + boxHeight}, RoundingRadius -> 0.1],
    Opacity[1],
    Black,
    Text[eventName,  {eventStartPoint + eventDuration /2,
      y + (2 * boxHeight/3)}],
    Text[eventLocation, {eventStartPoint + eventDuration /2,
      y + (boxHeight/3)}]
    }
   ];

Manipulate[
 yH = Length[days];
 g = Graphics[{
    Reap[
      Do[{
        (* background grid boxes - continue for an extra 2 hours *)
        Sow[Table[{Lighter[Gray, .9],
              Rectangle[{t, yH }, {t + 0.45, yH + boxheight}]},
             {t, Floor[firstEvent], lastEvent + 2, 0.5}]];
        (* event boxes *)
        Do[
         Sow[
          graphicsForEvent[event, boxheight, opacity, yH]],
           {event, eventsForDay[day]}];
          yH = yH - (boxheight + boxspacing )},
       {day, days}]][[2]]},
   BaseStyle -> {fontHeight, FontFamily -> "Helvetica", Bold},
   ImageSize -> 800,
   Epilog ->
    {
     Table[{Gray,
       Line[{{x, Length[days] + boxheight}, {x, Length[days] + 1}}],
       Text[x, {x + 0.1, Length[days] + (boxheight * 1.15)}]},
       {x, Floor[firstEvent], Ceiling[lastEvent] + 2}]
     }
   ],
 {opacity, 0.5, 1},
 {boxheight, 0.5, 1.5, Appearance -> "Labeled"},
 {boxspacing, 0.1, 0.5, Appearance -> "Labeled"},
 {{fontHeight, 10}, 7, 12, Appearance -> "Labeled"},
 Button["Export as PDF", Export["g.pdf", g]],
 ContinuousAction -> False
 ]
