Connected to this question, I want to do a zero-order interpolation of a bunch of datapoints which is periodic. The code I use is as follows:
dataSource = {{-0.225, 0.250}, {0.000, 0.250}, {0.225, 0.250}, {0.225,
0.250}, {0.296, 0.231}, {0.367, 0.108}, {0.367, 0.107}, {0.354,
0.048}, {0.341, 0.025}, {0.341,
0.025}, {0.265, -0.082}, {0.189, -0.190}, {0.189, -0.190}, {0.131,
-0.238}, {0.072, -0.250}, {0.072, -0.250}, {0.000, -0.250}, {-0.072,
-0.250}, {-0.072, -0.250}, {-0.131, -0.238}, {-0.189, -0.190},
{-0.189, -0.190}, {-0.265, -0.082}, {-0.341, 0.025}, {-0.341,
0.025}, {-0.354, 0.048}, {-0.367, 0.107}, {-0.367, 0.107}, {-0.296,
0.231}, {-0.225, 0.250}}

With[{ip = ListInterpolation[#, {{0, 1}}, InterpolationOrder -> 0,
  PeriodicInterpolation -> True] & /@ Transpose[dataSource]},
fdata[t_] := Through[ip[t]]]

ParametricPlot[fdata[t], {t, 0, 1}, AspectRatio -> Automatic]
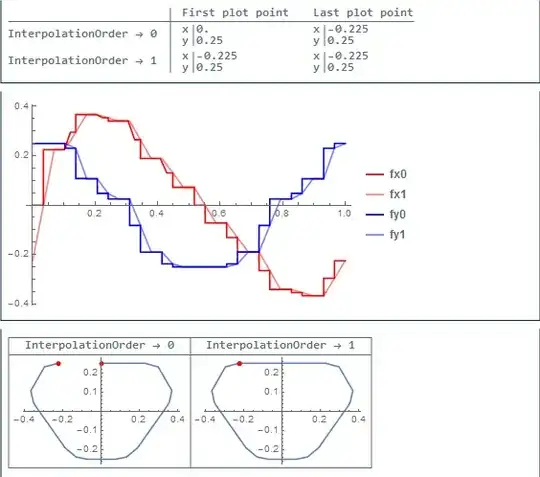
Which results in the following plot:

What I don't understand is why it doesn't draw the full contour? If I use InterpolationOrder -> 1 it does work, but I don't want to do that for other reasons. Can someone explain what is the problem that does not allow a periodic interpolation?
For clarification, the reason I don't want to use the first order interpolation is that it creates visual artifacts later on in the process:

As you can see the zero order extruded shape is nice and smooth, but with the gap from the cross-section. The first order extruded shape does not have this gap, but has a strange visual artifact.
The dataset for this last part is:
dataSource={{-0.225,0.250},{-0.192,0.250},{-0.160,0.250},{-0.128,0.250},{-0.096,0.250},{-0.064,0.250},{-0.032,0.250},{0.000,0.250},{0.032,0.250},{0.064,0.250},{0.096,0.250},{0.128,0.250},{0.160,0.250},{0.192,0.250},{0.225,0.250},{0.225,0.250},{0.230,0.250},{0.236,0.250},{0.242,0.249},{0.248,0.248},{0.254,0.247},{0.260,0.245},{0.266,0.244},{0.272,0.242},{0.278,0.240},{0.284,0.237},{0.290,0.234},{0.296,0.231},{0.302,0.227},{0.308,0.223},{0.314,0.219},{0.320,0.214},{0.326,0.208},{0.331,0.202},{0.337,0.195},{0.343,0.186},{0.349,0.176},{0.355,0.164},{0.361,0.148},{0.367,0.108},{0.367,0.107},{0.366,0.090},{0.365,0.083},{0.364,0.077},{0.363,0.072},{0.362,0.068},{0.361,0.065},{0.359,0.061},{0.358,0.058},{0.357,0.055},{0.356,0.053},{0.355,0.050},{0.354,0.048},{0.353,0.045},{0.352,0.043},{0.351,0.041},{0.350,0.039},{0.349,0.037},{0.347,0.035},{0.346,0.033},{0.345,0.032},{0.344,0.030},{0.343,0.028},{0.342,0.027},{0.341,0.025},{0.341,0.025},{0.330,0.010},{0.319,-0.006},{0.308,-0.021},{0.297,-0.036},{0.287,-0.052},{0.276,-0.067},{0.265,-0.082},{0.254,-0.098},{0.243,-0.113},{0.232,-0.128},{0.221,-0.144},{0.211,-0.159},{0.200,-0.174},{0.189,-0.190},{0.189,-0.190},{0.184,-0.196},{0.179,-0.202},{0.174,-0.207},{0.169,-0.212},{0.165,-0.216},{0.160,-0.220},{0.155,-0.224},{0.150,-0.227},{0.145,-0.230},{0.140,-0.233},{0.136,-0.235},{0.131,-0.238},{0.126,-0.240},{0.121,-0.242},{0.116,-0.243},{0.111,-0.245},{0.106,-0.246},{0.102,-0.247},{0.097,-0.248},{0.092,-0.249},{0.087,-0.249},{0.082,-0.250},{0.077,-0.250},{0.072,-0.250},{0.072,-0.250},{0.062,-0.250},{0.052,-0.250},{0.041,-0.250},{0.031,-0.250},{0.021,-0.250},{0.010,-0.250},{0.000,-0.250},{-0.010,-0.250},{-0.021,-0.250},{-0.031,-0.250},{-0.041,-0.250},{-0.052,-0.250},{-0.062,-0.250},{-0.072,-0.250},{-0.072,-0.250},{-0.077,-0.250},{-0.082,-0.250},{-0.087,-0.249},{-0.092,-0.249},{-0.097,-0.248},{-0.102,-0.247},{-0.106,-0.246},{-0.111,-0.245},{-0.116,-0.243},{-0.121,-0.242},{-0.126,-0.240},{-0.131,-0.238},{-0.136,-0.235},{-0.140,-0.233},{-0.145,-0.230},{-0.150,-0.227},{-0.155,-0.224},{-0.160,-0.220},{-0.165,-0.216},{-0.169,-0.212},{-0.174,-0.207},{-0.179,-0.202},{-0.184,-0.196},{-0.189,-0.190},{-0.189,-0.190},{-0.200,-0.174},{-0.211,-0.159},{-0.221,-0.144},{-0.232,-0.128},{-0.243,-0.113},{-0.254,-0.098},{-0.265,-0.082},{-0.276,-0.067},{-0.287,-0.052},{-0.297,-0.036},{-0.308,-0.021},{-0.319,-0.006},{-0.330,0.010},{-0.341,0.025},{-0.341,0.025},{-0.342,0.027},{-0.343,0.028},{-0.344,0.030},{-0.345,0.032},{-0.346,0.033},{-0.347,0.035},{-0.349,0.037},{-0.350,0.039},{-0.351,0.041},{-0.352,0.043},{-0.353,0.045},{-0.354,0.048},{-0.355,0.050},{-0.356,0.053},{-0.357,0.055},{-0.358,0.058},{-0.359,0.061},{-0.361,0.065},{-0.362,0.068},{-0.363,0.072},{-0.364,0.077},{-0.365,0.083},{-0.366,0.090},{-0.367,0.107},{-0.367,0.107},{-0.361,0.148},{-0.355,0.164},{-0.349,0.176},{-0.343,0.186},{-0.337,0.195},{-0.331,0.202},{-0.326,0.208},{-0.320,0.214},{-0.314,0.219},{-0.308,0.223},{-0.302,0.227},{-0.296,0.231},{-0.290,0.234},{-0.284,0.237},{-0.278,0.240},{-0.272,0.242},{-0.266,0.244},{-0.260,0.245},{-0.254,0.247},{-0.248,0.248},{-0.242,0.249},{-0.236,0.250},{-0.230,0.250},{-0.225,0.250}};


Plot[ftdata[t][[1]],{t,0,1}]this will begin to make sense. – george2079 Jul 26 '14 at 12:33ListLinePlot[dataSource]? This gives the same plot you seem to want. After all, a zero-order interpolation means connecting the points with straight lines, and this is what ListLinePLot is designed for. – bill s Jul 26 '14 at 12:55t = 1.001and did not see any discontinuities in the graph (for bothdataSources). My last comment was referring to you mentioning in your question that order 1 produces artifact, while in fact it doesn't (order 0 does). I suggest just using order 1 from now on. – seismatica Jul 28 '14 at 07:03