3

I actually already found my answer on the question, however it is not working. see BoxWhiskerChart with logarithmic axes

I want to create a boxwiskerchart with a logaritmic axes. But when I try ScalingFunctions with "Log" I do not get the results I am suppose to get. Sometimes it does not work at all. And sometimes I get the wiskers upside down. What am I doing wrong?

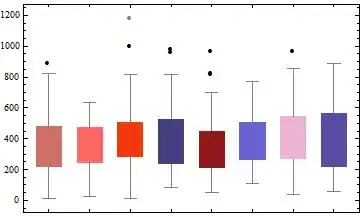
data = RandomVariate[RayleighDistribution[RandomInteger[500]], {8, 50}];
BoxWhiskerChart[data, "Outliers", ChartStyle -> 56]

enter image description here

BoxWhiskerChart[data, "Outliers", ChartStyle -> 56, ScalingFunctions -> "Log"]

enter image description here

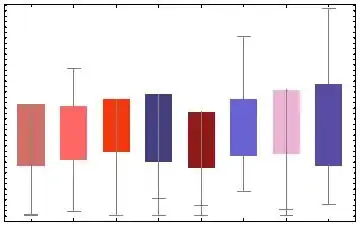
Also using Log10 does not work

BoxWhiskerChart[data, "Outliers", ChartStyle -> 56, ScalingFunctions -> "Log10"]

enter image description here

Wiebe
  • 167
  • 1
  • 10

1 Answers1

1

Here is a method that will work in version 9, although it requires you to install the CustomTicks package. Here is a BoxWhiskerChart using the normal linear scaling:

SeedRandom[420];
data = RandomVariate[
   RayleighDistribution[RandomInteger[500]], {8, 50}];
bwc = BoxWhiskerChart[data, "Outliers", ChartStyle -> 56]

Mathematica graphics

Here is the log-scaled chart you get from version 10,

BoxWhiskerChart[data, "Outliers", ChartStyle -> 56, 
 ScalingFunctions -> "Log10"]

Mathematica graphics

And here is the bootstrapped log-scale chart from version 9:

<< CustomTicks`
BoxWhiskerChart[Log10@data, "Outliers", ChartStyle -> 56, 
 FrameTicks -> {{LogTicks[10, 1, 4], 
    StripTickLabels[LogTicks[10, 1, 4]]}, {Automatic, Automatic}}]

Mathematica graphics

J. M.'s missing motivation
  • 124,525
  • 11
  • 401
  • 574
Jason B.
  • 68,381
  • 3
  • 139
  • 286