8

I would like to make a following chart

BoxWhiskerChart with log y-axis

Ideally I would also like to control the boxes position on a logarithmic x-axis.

Some inspiration how to do the latter may be found in the answer to my other question: How to controll position on the x-axis of a boxWhiskerChart

TIA:)

JohnnyM
  • 489
  • 4
  • 11
  • Seems like you'll have to build such a plot from scratch, I see no easy way to use the existing functionality. This means working directly with Graphics primitives to construct the display. – Jens Jan 31 '13 at 18:59
  • @Jens crap. How come gnuplot has it and mathematica don't. – JohnnyM Jan 31 '13 at 19:55
  • @Jens there is a way: the option ScalingFunctions. I've added an answer detailing how it works. – rcollyer Feb 01 '13 at 03:05

2 Answers2

15

Buried in the Details section of the documentation for BoxWhiskerChart is a reference to an option called ScalingFunctions which when set "the data coordinate is scaled using s." So, first some data:

data = RandomVariate[RayleighDistribution[RandomInteger[500]], {8, 50}];

without the scaling functions:

BoxWhiskerChart[data, "Outliers", ChartStyle -> 56]

Mathematica graphics

and with ScalingFunctions set to "Log":

BoxWhiskerChart[data, "Outliers", ChartStyle -> 56, ScalingFunctions -> "Log"]

Mathematica graphics

You might need a custom list of FrameTicks to get the desired formatting. Some ideas to get you started can be found here, here and here.

rcollyer
  • 33,976
  • 7
  • 92
  • 191
2

Here is an example using the commercial Presentations package (which I develop).

<<Presentations`

Here are some data sets defined by their Log10 values.

data[1] = Array[RandomReal[{0, 1}] &, 10];
data[2] = Array[RandomReal[{0, 1.5}] &, 10];
data[3] = Array[RandomReal[{-1, 1}] &, 10];
data[4] = Array[RandomReal[{-0.5, 0.5}] &, 10];
data[5] = Array[RandomReal[{-0.5, 1}] &, 10];

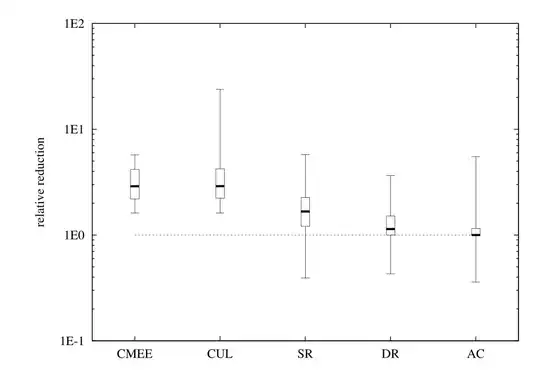
Here is the BoxWhisker plot code.

xticks = CustomTicks[Identity, 
   databased[{{1, "CMEE"}, {2, "CUL"}, {3, "SR"}, {4, "DR"}, {5, 
      "AC"}}]];
yticks = CustomTicks[
   Log10, {-1, 2, {1, 2, 5} // N, {3, 4, 6, 7, 8, 9}}];
Draw2D[
 {{Dotted, Line[{{0, Log10[1]}, {6, Log10[1]}}]},
  ({BoxWhiskerDraw[data[#],
         ChartStyle -> 
          Directive[FaceForm[Opacity[0.2, Blue]], EdgeForm[Black], 
           Thin]],
        CirclePoint[{0, #}, 3, Black, White] & /@ data[#]} // 
       ScaleOp[{1, 1}, {0, 0}] // TranslateOp[{#, 0}]) & /@ Range[5]},
 AspectRatio -> 0.8,
 Frame -> True,
 FrameTicks -> {{yticks, yticks // NoTickLabels}, {xticks, 
    xticks // NoTickLabels}},
 PlotLabel -> Style["BoxWhisker Chart with Log Y Scale", 13, Bold],
 ImageSize -> 400]

And here is the plot:

Mathematica graphics

Verbeia
  • 34,233
  • 9
  • 109
  • 224
David Park
  • 2,613
  • 18
  • 14