2

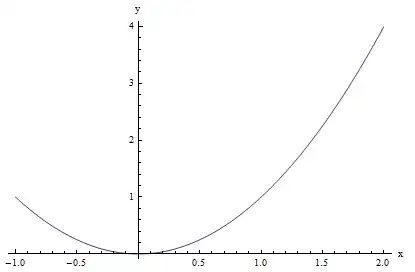
I have written a function Fun as below:

Fun[x_Symbol, xrange_, imageSize_, axeslabel_] :=
 Plot[x^2, {x, xrange[[1]], xrange[[2]]}, 
   ImageSize -> imageSize, 
   AxesLabel -> axeslabel]

Fun[x, {-1, 2}, 400, {"x", "y"}]

enter image description here

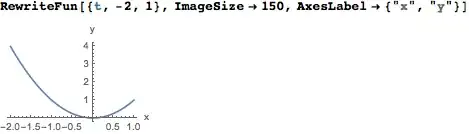
However, I'd like to rewrite it to use OptionsPattern

RewriteFun[x_Symbol, OptionsPattern[Plot]] := 
  Plot[x^2, {x, -1, 2}, 
    ImageSize -> OptionValue[ImageSize], 
    AxesLabel -> OptionValue[AxesLabel]]

RewriteFun[x, ImageSize -> 400, AxesLabel -> {"x", "y"}]

enter image description here

I have two problems.

  • I don't know how to deal with an option like {x, xmin, xmax}.

  • I don't how to get the kind of syntax coloring the varible x has in Plot[x^2, {x, -1, 2}].

enter image description here

So my question is: How do I revise the RewriteFun to solve my problems?

m_goldberg
  • 107,779
  • 16
  • 103
  • 257
xyz
  • 605
  • 4
  • 38
  • 117

2 Answers2

4

Here's my interpretation of the question:

ClearAll[RewriteFun];
SetAttributes[RewriteFun, HoldAll];
Options[RewriteFun] = Options[Plot];
SyntaxInformation[
   RewriteFun] = {"ArgumentsPattern" -> {{_, _, _}, 
     OptionsPattern[Plot]}, "LocalVariables" -> {"Plot", {1}}};
RewriteFun[dom : {x_, _, _}, OptionsPattern[]] := 
 Plot[x^2, dom, ImageSize -> OptionValue[ImageSize], 
  AxesLabel -> OptionValue[AxesLabel]]

RewriteFun[{t, -2, 1}, ImageSize -> 150, AxesLabel -> {"x", "y"}]

Mathematica graphics

Michael E2
  • 235,386
  • 17
  • 334
  • 747
2

You could do the following:

Options[fun] = {ImageSize -> 400, AxesLabel -> {"x", "y"}, xmin -> -1, xmax -> 2};

fun[x_Symbol, OptionsPattern[]] :=
 Plot[x^2, {x, OptionValue@xmin, OptionValue@xmax}, 
  ImageSize -> OptionValue@ImageSize, 
  AxesLabel -> OptionValue@AxesLabel]

fun[z, xmin -> -2, AxesLabel -> {"z", "y"}]

enter image description here

You could even turn the symbol (or the whole function) into an option:

Options[fun] = {ImageSize -> 400, AxesLabel -> {"x", "y"}, symbol -> x, xmin -> -1, xmax -> 2};

fun[OptionsPattern[]] :=
 Block[{sym = OptionValue@symbol},
  Plot[sym^2, {sym, OptionValue@xmin, OptionValue@xmax},
   ImageSize -> OptionValue@ImageSize,
   AxesLabel -> OptionValue@AxesLabel]]
eldo
  • 67,911
  • 5
  • 60
  • 168