I want to draw a normalized tangent arrow, so I use the Normalize command as follows:
tangent =
  Table[{{t, Sin[t]}, {t, Sin[t]} + Normalize @ {1, Cos[t]}}, {t, -π, π, π/2}];
Plot[Sin[x], {x, -2 π, 2 π},
  PlotRange -> 2, Epilog -> {Red, Arrowheads[0.02], Arrow /@ tangent}]
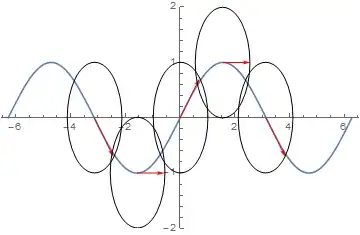
and I get this plot:

Seems good, but if take a close look at the length of the arrows, you'll see that the length is not normalized at all.
I've tried the Show and Graphics command instead of Epilog, but got the same plot.
Can someone tell me what I missed here?
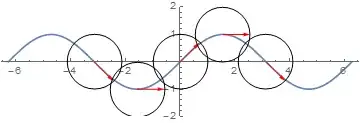
1/GoldenRatio. AddAspectRatio -> Automaticto your plot options – m_goldberg Aug 04 '14 at 03:56