The question was reopened after I went to bed, so it seems like I left the party early. :)
In any case, LogPlot[f, <>] of course is the plot of Log[f] with the tick labels and positions adjusted to correspond. So the slope of the tangent is given by the derivative of Log[f]. Using the variable x for my own convenience, the tangent arrow (of length 0.5) at x = x0 is given by
f = (1 - x)^(-0.5);
f0 = Log[f] /. x -> x0;
df0 = D[Log[f], x] /. x -> x0;
Arrow[{{x0, f0}, {x0, f0} + 0.5 Normalize[{1, df0}]}]
The Arrow can be added to a plot with Epilog, Prolog, or using Show and Graphics.
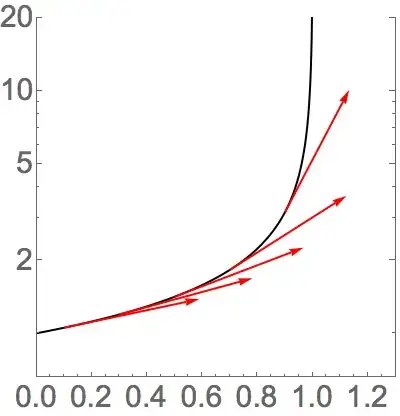
If you wish to display several arrows of the same geometric length in a plot, they will not appear to have the same length unless AspectRatio is set to Automatic (or the slopes of the arrows accidentally have the same magnitude). If you can wait an extra tenth of a second or so, you can fix it so that the arrows will have lengths that will appear the same in the output. If we let ar be the ratio of the aspect ratio of the PlotRange to the value of AspectRatio (see further down for code), then the length of the tangent should be given by the following to have any arrow appear to have the same length:
Arrow[{{x0, f0}, {x0, f0} + 0.5 {1, df0} / Norm[{1, df0*ar}]}]
Again, the 0.5 can be adjusted to suit a particular application.
The code for calculating ar is based on Alexey Popkov's completePlotRange for computing the actual PlotRange of a plot.
completePlotRange[plot : (_Graphics | _Graphics3D | _Graph)] :=
Last@Last@
Reap[Rasterize[
Show[plot, Axes -> True, Frame -> False, Ticks -> ((Sow[{##}]; Automatic) &),
DisplayFunction -> Identity, ImageSize -> 0],
ImageResolution -> 1]]
Block[{f, f0, df0, ar, plot},
f = (1 - x)^(-0.5);
f0 = Log[f] /. x -> x0;
df0 = D[Log[f], x] /. x -> x0;
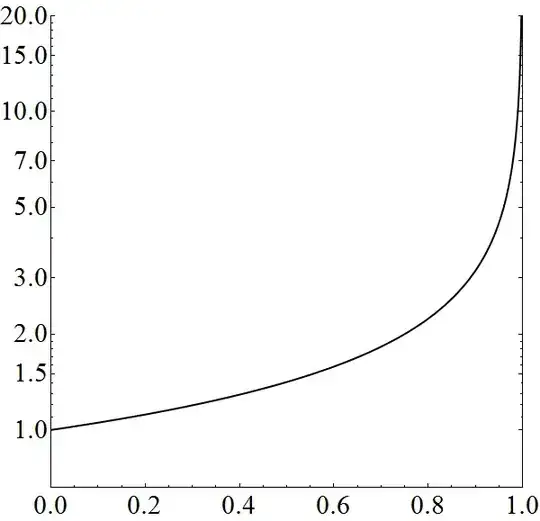
plot = LogPlot[f, {x, 0, 1}, PlotRange -> {{0, 1.3}, {0.66, 20}},
Frame -> {{True, True}, {True, False}}, ImageSize -> 400,
PlotStyle -> {Directive[Black, Thick], Automatic},
BaseStyle -> {FontSize -> 30}, RotateLabel -> False,
AspectRatio -> 1
];
ar = If[(AspectRatio /. Options[plot, AspectRatio]) === Automatic,
1,
(AspectRatio /. Options[plot, AspectRatio])/
Ratios[Differences /@ completePlotRange@plot][[1, 1]]
];
Show[
plot,
Graphics[{Red, Thick,
Table[Arrow[{{x0, f0}, {x0, f0} + 0.5 {1, df0}/Norm[{1, df0*ar}]}], {x0, 0.1, 0.9, 0.2}]}]
]
]


LogPlotinstead ofPlot/ParametricPlotmakes it sufficiently distinct from the related questions or proposed duplicate. Certainly, the code in those questions does not work as is (without adjusting for the difference in the coordinate system). – Michael E2 Aug 15 '14 at 14:48