I would like to use something like Point[x,y] to plot diamonds instead of small circles ("points"). I'm creating charts from scratch inside a Graphics expression using my own graphics functions. I've looked through the documentation and questions here and haven't found anything about how to do it.
Asked
Active
Viewed 1,304 times
5
m_goldberg
- 107,779
- 16
- 103
- 257
George Wolfe
- 5,462
- 21
- 43
-
Have you looked at this? – m_goldberg Aug 10 '14 at 16:39
-
I've seen your icon, but it hadn't registered as an example of what I wanted to do. Did you use translate? – George Wolfe Aug 10 '14 at 16:43
-
Sorry, I don't understand what you mean by "your icon". I gave a link to a previous posted question that I think relevant to yours. – m_goldberg Aug 10 '14 at 16:47
-
@m_goldberg I believe he meant your SE avatar which is automatically generated. It has some rhombi in its corners. – Jens Aug 10 '14 at 23:13
3 Answers
4
I use Translate for this purpose, which can not only translate along a single vector, but can create multiple copies translated along different vectors.
For example, let's use these (relative) positions:
points = RandomReal[10, {10, 2}]
Then
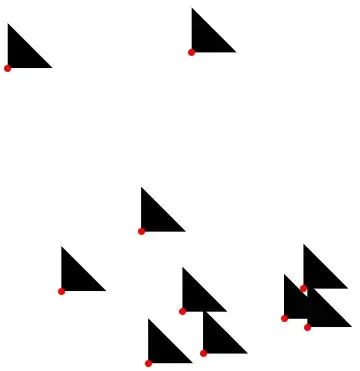
Graphics[
 Translate[Triangle[], points]
]

Just make sure that your source object is centred around {0,0}, otherwise the plot will be misaligned, like here:
Graphics[
 {Translate[Triangle[], points],
  Red, PointSize[Large], Point[points]}
]
I was just lazy to make a proper diamond so I use Triangle ...
Szabolcs
- 234,956
- 30
- 623
- 1,263
-
Graphics[Translate[Rotate[Rectangle[], 45 Degree], points]]for diamonds? – kglr Aug 10 '14 at 16:19 -
@kguler That is not centred on
{0,0}, so we get back to me being lazy to make a proper diamond ;-) – Szabolcs Aug 10 '14 at 16:22 -
@Szabolcs Yet another function I didn't know about. Translate seems pretty handy. It seems like it should work. – George Wolfe Aug 10 '14 at 16:38
-
3
I would define a function diamond that draws diamonds centered at given point and with a specified bounding box.
diamond[xy : {x_, y_} : {0, 0}, wh : {w_, h_} : {1, 1}] :=
 Translate[Polygon[{{w/2., 0.}, {0., h/2.}, {-w/2., 0}, {0., -h/2.}}], xy]
Graphics[
  Table[{Hue[RandomReal[]], diamond[RandomReal[1, {2}], RandomReal[.2, {2}]]}, {200}]]

m_goldberg
- 107,779
- 16
- 103
- 257
-
How does the syntax [xy : {x_, y_} : {0, 0} work? Is it like a chain of defaults? – George Wolfe Aug 11 '14 at 00:22
-
2@GeorgeWolfe. It does look like a chain of defaults, but it isn't. The full-form of the first argument to
diamondisOptional[Pattern[xy, List[Pattern[x, Blank[]], Pattern[y, Blank[]]]], List[0, 0]], so it can be read(<pattern-name> : <pattern>) : <default>. Colon ( : ) is one of few operators in Mathematica that is interpreted differently according to context. The first colon is interpreted as the infix form ofPatternand the second as the infix form ofOptional. – m_goldberg Aug 11 '14 at 02:56
2
here some examples how to define your own PlotMarkers
plotmarkers =
 colors //
  Map[Graphics[{#, Disk[]}, ImageSize -> 8] //
      ToString[#, FormatType -> StandardForm] & // Function, #] &
ListPlot[{{1, 2, 3, 5, 8}, {2, 3, 6, 9, 10}, {4, 5, 7, 10, 12}},
 PlotMarkers -> plotmarkers, PlotRange -> All,
 PlotRangeClipping -> False]

plotmarkers = {Style["\[FilledDiamond]", 16, Lighter@Red],
  Style["\[FilledDiamond]", 16, Lighter@Blue],
  Style["\[FilledDiamond]", 16, Lighter@Green]}
ListPlot[{{1, 2, 3, 5, 8}, {2, 3, 6, 9, 10}, {4, 5, 7, 10, 12}},
 PlotMarkers -> plotmarkers, PlotRange -> All,
 PlotRangeClipping -> False]
You may use Inset or Text to place them accordingly in Graphics, or if available the Option PlotMarkers -> yourPlotmarkers

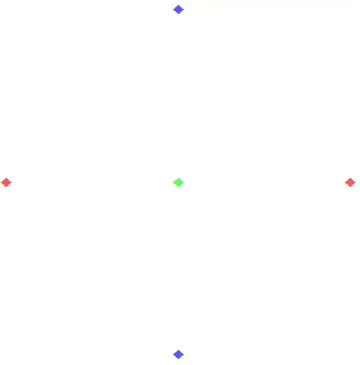
plotmarkers = {Style["\[FilledDiamond]", 16, Lighter@Red],
  Style["\[FilledDiamond]", 16, Lighter@Blue],
  Style["\[FilledDiamond]", 16, Lighter@Green]}
point[x_, y_, which_] := Inset[plotmarkers[[which]], {x, y}]
Graphics[{point[1, 0, 1], point[-1, 0, 1], point[0, 1, 2],
  point[0, -1, 2], point[0, 0, 3]}]
hieron
- 1,167
- 6
- 13