13

By combining the state data from here and the extrusion code from here I have managed to make prisms of the various US states such as

enter image description here

However, the extrusion method looses information about the states relative position so I cant reassemble them into a map of the US states which is my final goal: a map with states projected upward by different amounts corresponding to a parameter I have (something like population or total sales) to make a 3D histogram of sorts. I have the seen the last example here(How to Plot Prism in Graphics3D) which has the right geometry but is not at a level of quality I can use in my work. Moreover, the final infographic may have additional data on the state surfaces like colored points indicating hotsopts so that solution wont extend.

sonright
  • 141
  • 5
  • Have you tried getting the data from here: EntityValue[Entity["AdministrativeDivision", {"Florida", "UnitedStates"}], "Polygon"], rather than the old CountryData? – Carlo Aug 21 '14 at 18:44
  • yes, I still end up with the same problem, namely that that coordinate data gets lost once I use the extrusion method. One solution might be to plot a surface where the states have different heights(z-coords) and then fill down but I dont know how to create that surface either. Perhaps if we had an InteriorQ[pt,poly] function? – sonright Aug 21 '14 at 18:59

2 Answers2

16

Here is a bit clumsy (had very little time) approach виа combination of new functionality Entity and regions.

(* get the states *)
divisions = 
  EntityValue[Entity["AdministrativeDivision", {_, "UnitedStates"}], 
   "Entities"];

(* get polygons of borders *)
dat = EntityValue[
    divisions, {"Population", "Polygon"}] /. {GeoPosition -> Identity,
     Quantity[x_, _] -> x};

(* some arbitrary rescaling to improve relative height perception *)
pop = Rescale[(# - Min[#]) &@Log[dat[[All, 1]]] // N];

(* plot constants of population of regions of polygons *)
polygs = Plot3D[#1, {x, y} \[Element] #2, Mesh -> None, Filling -> 0, 
     ColorFunction -> "Rainbow", ColorFunctionScaling -> False] & @@@ 
   Transpose[{pop, dat[[All, 2]]}];

(* combine all *)
Show[polygs, PlotRange -> {{23, 50}, {-60, -130}, All}, 
 BoxRatios -> {27, 70, 50}, ImageSize -> 800, Boxed -> False, 
 Axes -> False]

enter image description here

enter image description here

Vitaliy Kaurov
  • 73,078
  • 9
  • 204
  • 355
  • 5
    The fact that this map is east-west reversed gives me a headache! – evanb Aug 21 '14 at 22:22
  • 11
    This is a nice solution, but the result shows why this kind of presentation obsfucates information rather than revealing it. If Edward Tufte weren't still alive, he'd be spinning in his grave! – Verbeia Aug 22 '14 at 01:05
  • 3
    Could you revise your answer to orient the USA correctly? – m_goldberg Aug 22 '14 at 01:07
  • Take the final image and reverse by ImageRotate[ImageReflect[image], Pi] – bill s Aug 22 '14 at 14:56
  • TO ALL sorry folks, I am a bit out of time. Please feel free to edit post to flip the map - just mark it as an update and keep the original. Thanks everyone! – Vitaliy Kaurov Aug 22 '14 at 16:31
  • add /. {{x_?NumericQ, y_?NumericQ} :> {y, x}}; to dat then it will be flipped.. – halmir Aug 25 '14 at 13:29
13

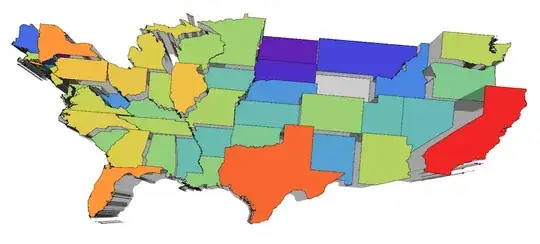
Here's another approach :

(* divide polygon pts to clean up artificials when polygon has holes *)
FindContourBreaks[pts_List] := 
  Module[{i, lines, breaks = {}}, 
   lines = {pts[[#[[1]]]], pts[[#[[2]]]]} & /@ 
     Partition[RotateLeft[Flatten[{#, #} & /@ Range[Length[pts]], 1]],
       2];
   Position[lines, 
     Alternatives @@ 
      Intersection[{lines[[All, 2]], lines[[All, 1]]} // Transpose, 
       lines]] // Flatten
   ];

FindContourBreak[pts_List] := 
  Module[{breaks, ranges}, breaks = FindContourBreaks[pts];
   ranges = 
    Partition[
     RotateLeft[Join[{1, 1}, Flatten[{#, # + 1} & /@ breaks]]], 2];
   ranges = Drop[ranges, -1];
   DeleteCases[Range @@@ ranges, x_ /; Length[x] < 3]];

(*generate side polygons - heights *)
SideComplex[pts_List, length_] := 
  Module[{topPts, botPts, sideRects, sidePts, sideNormals},
   topPts = pts;
   botPts = (2 length + 1 - #) & /@ topPts;
   sideRects = 
    Partition[
     RotateLeft[Flatten[{#, #} & /@ Range[Length[topPts]], 1]], 2];
   sidePts = {topPts[[#[[1]]]], botPts[[#[[1]]]], botPts[[#[[2]]]], 
       topPts[[#[[2]]]]} & /@ sideRects;
   Polygon@sidePts];

(* main code - it create top, bottom, and side polygons *)
To3DComplex[Polygon[list_], depth_: 10] := To3DComplex[list, depth]

To3DComplex[list_List, depth_: 10] /; (Depth[list] == 3) := 
 Module[{topPts, botPts, length, contours, sidePolys},
  topPts = {#[[1]], #[[2]], depth} & /@ list;
  botPts = Reverse[{#[[1]], #[[2]], 0} & /@ topPts];
  length = Length[list];
  contours = FindContourBreak[list];
  sidePolys = SideComplex[#, length] & /@ contours;
  GraphicsComplex[
   Join[topPts, botPts], {Polygon[Range[length]], 
    Polygon[Range[length + 1, 2 length] // Reverse], EdgeForm[], 
    sidePolys}]
  ]

To3DComplex[list_List, depth_: 10] := To3DComplex[#, depth] & /@ list

Here's example:

(* states except Alaska and Hawaii *)
 divisions = 
 EntityValue[
  Entity["AdministrativeDivision", {Except["Alaska" | "Hawaii"], 
    "UnitedStates"}], "Entities"];

project geoposition to mercator :

dat = (EntityValue[divisions, {"Population", "Polygon"}] /. 
      GeoPosition[x_] :> 
       GeoGridPosition[GeoPosition[x], "Mercator"]) /. 
    GeoGridPosition[x_, "Mercator"] :> x /. Quantity[x_, _] :> x;

rescale population for color function and depth:

pop = Rescale[(# - Min[#]) &@Log[dat[[All, 1]]] // N];

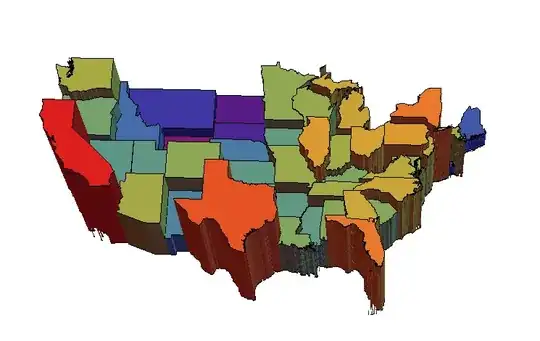
final result (I multiply 20 for depth):

poly = {ColorData["Rainbow"][#1], To3DComplex[#2, 20 #1]} & @@@ 
   Transpose[{pop, dat[[All, 2]]}];

Graphics3D[poly, ImageSize -> 800, Boxed -> False]
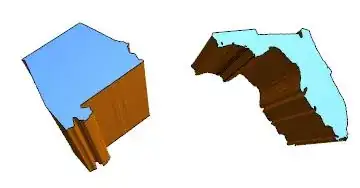
enter image description here

halmir
  • 15,082
  • 37
  • 53
  • Hi Halmir, I like your solution and am trying to get it work at the country level, for African and European countries. Unfortunately, while ToComplex3D creates the top and bottom polygons, I don't get any side polygons and can't figure out why. In both cases (Africa & Europe) I just get two sets of countries floating above each other. Any suggestions would be appreciated. Thanks! – Paul Clip Jul 18 '17 at 05:13
  • I think it may be an issue with the coordinate space and FindContourBreaks. Europe & Africa both span the Greenwich meridian, and Africa spans the Equator too. Maybe translating the continents so lat / lon are uniformly of the same sign is what's needed? – Paul Clip Jul 18 '17 at 05:37