I am trying to export a plot generated by MatrixPlot to PDF but am having problems with the way the exported PDF is rendered.
  mPlot = MatrixPlot[length,
  Epilog -> {Cyan,
    MapIndexed[If[#1 != 0, Text[#1, Reverse[#2 - 1/2]]] &,
     Reverse[number], {2}]}, Mesh -> True,
  FrameTicks -> {{Table[i, {i, 9}],
     MapIndexed[{First[#2], regionCodes[[#1]]} &,
      Table[i, {i, 9}]]}, {Table[i, {i, 9}],
     MapIndexed[{First[#2], Rotate[regionCodes[[#1]], 90 Degree]} &,
      Table[i, {i, 9}]]}}, ColorFunctionScaling -> False,
  PlotRange -> {Min[length], Max[length]}]
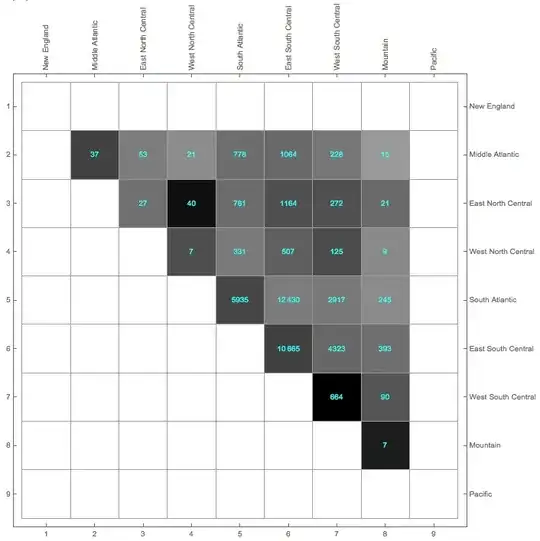
The matrices length (plotted as shades of gray in the figure below), number (shown as the cyan numbers in the figure below), and regionCodes have the following values
length = {{0, 0, 0, 0, 0, 0, 0, 0, 0}, {0, 0.079774, 0.0545131,
   0.0484267, 0.0614324, 0.0627509, 0.0572262, 0.0424639, 0}, {0, 0,
   0.0600802, 0.100418, 0.0615561, 0.0737833, 0.0732888, 0.0624553,
   0}, {0, 0, 0, 0.0740108, 0.0559982, 0.0666054, 0.0749018,
   0.0493431, 0}, {0, 0, 0, 0, 0.0774839, 0.0554172, 0.0564699,
   0.0491287, 0}, {0, 0, 0, 0, 0, 0.0798436, 0.0643044, 0.0606039,
   0}, {0, 0, 0, 0, 0, 0, 0.107009, 0.0713126, 0}, {0, 0, 0, 0, 0, 0,
   0, 0.0951722, 0}, {0, 0, 0, 0, 0, 0, 0, 0, 0}}
number = {{0, 0, 0, 0, 0, 0, 0, 0, 0}, {0, 37, 53, 21, 778, 1064, 228,
    15, 0}, {0, 0, 27, 40, 761, 1164, 272, 21, 0}, {0, 0, 0, 7, 331,
   507, 125, 9, 0}, {0, 0, 0, 0, 5935, 12430, 2917, 245, 0}, {0, 0, 0,
    0, 0, 10665, 4323, 393, 0}, {0, 0, 0, 0, 0, 0, 664, 90, 0}, {0, 0,
    0, 0, 0, 0, 0, 7, 0}, {0, 0, 0, 0, 0, 0, 0, 0, 0}}
regionCodes = {"New England", "Middle Atlantic", "East North Central",
   "West North Central", "South Atlantic", "East South Central",
  "West South Central", "Mountain", "Pacific"}
This is length//MatrixForm

And this is number//MatrixForm

The plot looks like this when shown in Mathematica
But the exported PDF is rendered as follows (shown in OS X Preview)

There is a lot of shading and (and anti-aliasing?) going on (it shouldn't!). The only solution I have come up with is to rasterize the plot before exporting it. It does the job, but I don't consider it very elegant.
Export["regionIBD_MatrixPlot.pdf", Rasterize[mPlot, ImageResolution -> 600], ImageSize -> Full]
The funny thing is that if I export it as TIFF, it renders correctly. Is there a way to export the plot as a vector graphics and not as a bitmap?


vectors for simple graphicsand/orhigh resolution rasterized image. And please post code and data, if people are willing to help this is very helpful. – Aug 26 '14 at 18:36"AllowRasterization" -> True, it produced the same shaded(!) PDF, hence my use ofRasterize[].Oh, and I have posted code and data! Is it not readable? Did I use an incorrect format?
– darXider Aug 26 '14 at 18:41epstopdfproduced the same old shaded PDF. – darXider Aug 26 '14 at 19:20