4

I have a list of lists looking like this: {{{x1, y1}, {x2, y2}}, {x1, y1},...}}. Furthermore I have defined a legend, which is taken from the filenames. 
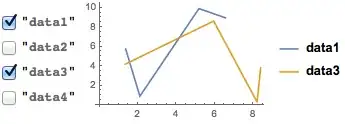
Now I want to plot this data dynamically, add/remove sub-lists in a ListLinePlot, e.g. with a Checkbox. This is the part of the code I have so far:

Importing the data:

files = FileNames["*.dat"];
data = Import[#, "Data"] & /@ files;
legend = StringReplace[files, ".dat" -> ""];

So far I have made the plot like this:

plot1 = ListLinePlot[data[[1]], PlotLegends -> legend[[1]]];
plot2 = ListLinePlot[data[[2]], PlotLegends -> legend[[2]]];

Manipulate[
Show[
  If[x1 == True, plot1, Sequence @@ {}],
  If[x2 == True, plot2, Sequence @@ {}],
  {{x1, True, "plot1"}, {True, False}}, {{x2, True, "plot2"}]

Is there maybe a more elegent way of realizing this, maybe automatically, for list of sub-lists?

andeee
  • 43
  • 3

3 Answers3

5

Here's a version with checkboxes:

numData = 4;
data    = Sort /@ RandomReal[{0, 10}, {5, numData, 2}];
legend  = Table["data" <> ToString@i, {i, numData}];

DynamicModule[
  { dataCombinations = {} }
  ,
  Grid @ {{
    CheckboxBar[
      Dynamic @ dataCombinations, 
      Thread[Range[numData] -> legend], 
      Appearance -> "Vertical"
    ],
    Dynamic @ ListPlot[
      data[[dataCombinations]], 
      Joined -> True, 
      PlotLegends -> legend[[dataCombinations]]
    ]
 }}
]

Mathematica graphics

Teake Nutma
  • 5,981
  • 1
  • 25
  • 49
4

Using some made-up test data to illustrate. This approach is also used here with fading transitions.

data1 = Table[Sin[x], {x, 0, 2 Pi, Pi/4}];
data2 = Table[Cos[x], {x, 0, 2 Pi, Pi/4}];

plot1 = ListLinePlot[data1, DataRange -> {0, 2 Pi}];
plot2 = ListLinePlot[data2, DataRange -> {0, 2 Pi}];

id = ImageDimensions[plot1];

Manipulate[Graphics[{White, Rectangle[{0, 0}, id],
   Switch[chart,
    "   Plot 1   ", Inset[plot1, Center, Center, id],
    "   Plot 2   ", Inset[plot2, Center, Center, id],
    " Plot 1 & 2 ", Inset[Show[plot1, plot2], Center, Center, id]]},
  PlotRange -> {{0, First[id]}, {0, Last[id]}}, ImageSize -> id],
 {{chart, "   Plot 1   ", "Displayed: "},
  {"   Plot 1   ", "   Plot 2   ", " Plot 1 & 2 "}},
 ControlType -> SetterBar, SaveDefinitions -> True]

enter image description here

Chris Degnen
  • 30,927
  • 2
  • 54
  • 108
4

Consider:

plot1 = Plot[Sin[x], {x, 0, 6 Pi}];
plot2 = Plot[Cos[x], {x, 0, 6 Pi}];

TogglerBar[Dynamic[p], {plot1 -> "Plot 1", plot2 -> "Plot 2"}]

Dynamic[p /. {x__} :> Show[x]]

See TogglerBar and CheckboxBar.

Mr.Wizard
  • 271,378
  • 34
  • 587
  • 1,371