The following tries to let the user use whatever PlotStyle and any other Plot options they desire. It assumes Plot yields a list of directives and lines for each function plotted, in the order given in the arguments.
I seemed to run into obstacles with standard controls, so I wrote my own plus a helper function.
getPlotStyles returns the directives for the plot of each function. These are needed to make the label (used as a legend).clickToggler switches between two expressions per mouse click. Perhaps Toggler could be used, but it didn't work for me.makeLabel puts together a clickable legend that turns graphs on/off. It is a grid of clickTogglers.
Preliminary definitions:
getPlotStyles[nFuncs_, funcs_, dom_, opts___] :=
  With[{style = PlotStyle /. FilterRules[{opts}, PlotStyle]},
   Thread[{Table[ColorData[1][i], {i, nFuncs}],
     If[style =!= PlotStyle, If[Head[style] === List,
       style, ConstantArray[style, nFuncs]], ConstantArray[{}, nFuncs]]}]];

clickToggler[Dynamic[x_], e_, opts : OptionsPattern[]] := clickToggler[Dynamic[x], e, e, opts];
clickToggler[Dynamic[x_], on_, off_, opts : OptionsPattern[]] :=
  EventHandler[Dynamic[If[x, on, off]], {"MouseClicked" :> (x = ! x)}, opts];

makeLabel[Dynamic[display_], styles_, funcs_] :=
  With[{background = {Opacity[0], Rectangle[{-2, -1}, {2, 1}]},
    circleslash = {Thickness[Medium], Dashing[{}], Opacity[1], Red, Circle[],
      Line[{{-1, -1}, {1, 1}}/Sqrt[2]]}},
   Grid[Table[With[{i = i}, (* { sample styled line, label } *)
      {Graphics[{Append[styles[[i]], {Line[{{-2, 0}, {2, 0}}],
           clickToggler[Dynamic[display[[i]]], background, {background, circleslash}]}]},
        ImageSize -> {24, 12}, AspectRatio -> 1/2],
       clickToggler[Dynamic[display[[i]]],
        Panel[TraditionalForm[funcs[[i]]], Background -> White, FrameMargins -> 1]]}
     ], {i, Length@funcs}], BaseStyle -> "Label", Alignment -> {Center, Center}]];
myPlot plots the graph and has the following features:
It is called just like Plot and all its arguments are passed to Plot, so hopefully most of Plots features still work.
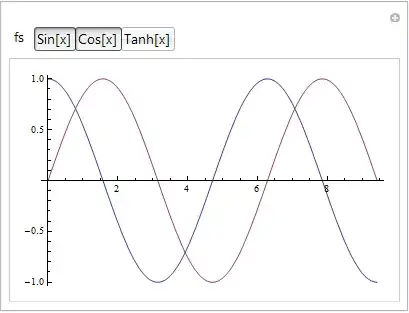
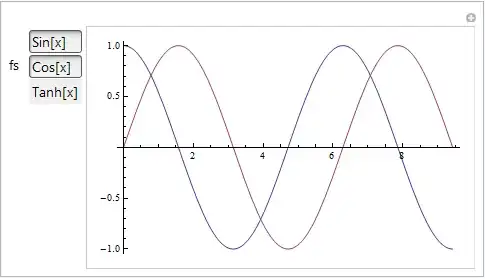
It takes each graph and wraps it in a clickToggler (defined above) that turns the graph off if it is clicked.
If whitespace in the plot is clicked, a menu pops up that toggles the graphs on/off. Click away from it to make it disappear.
It uses Labeled to add an interactive legend for turning graphs on/off. Ideally either the PlotLegend option would be intercepted and replaced with this, or myPlot would have this as its own option.
The code allows for the list of functions to be wrapped by Tooltip etc. The first two definitions are the way in. The third is called by the first two. The fourth at the very end lets a single function not in a List be plotted like normal, no legend, no clicking on/off.
SetAttributes[myPlot, HoldAll];
myPlot[wrapper_[funcs_List], rest___] := With[{n = Length[funcs]}, myPlot[n, funcs, wrapper@funcs, rest]];
myPlot[funcs_List, rest___] := With[{n = Length[funcs]}, myPlot[n, funcs, funcs, rest]];
myPlot[nFuncs_Integer, funcs_, plotargs___] :=
  DynamicModule[{
        display = ConstantArray[True, nFuncs], (* array of T/F indicating a graph is on/off *)
           plot, (* the base Plot *)
            pos, (* the positions of the group of lines making up each graph *)
         curves, (* the graphics commands making up each graph *)
         styles, (* the styles of each graph *)
      popupmenu},(* variable that toggles between the popup menu and nothing *)
    popupmenu = {}; (* popupmenu starts off blank *)
    plot = Show[Plot[plotargs], Graphics[Dynamic@popupmenu]];
    pos = DeleteDuplicates[Most /@ Position[plot, _Line, \[Infinity]]];
    curves = Extract[plot, pos];
    styles = getPlotStyles[nFuncs, plotargs];
    Labeled[
     EventHandler[Dynamic@ReplacePart[plot,
         Table[With[{i = i},
          pos[[i]] -> clickToggler[Dynamic[display[[i]]], curves[[i]], Line[{}], PassEventsUp -> False]],
          {i, nFuncs}]],
      {"MouseClicked" :> (popupmenu =
          If[popupmenu === {},
            Inset[Framed[makeLabel[Dynamic[display], styles, funcs],
             Background -> White, FrameStyle -> Thin], MousePosition["Graphics"]],
            {}])}
      ],
     makeLabel[Dynamic[display], styles, funcs],
     Right],
    SaveDefinitions -> True];
myPlot[X___] := Plot[X]; (* default to Plot *)
Example
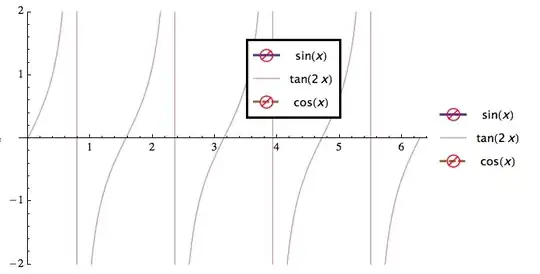
myPlot[Tooltip@{Sin[x], Tan[2 x], Cos[x]}, {x, 0, 2 π}, PlotRange -> 2,
 PlotStyle -> {Thick, Opacity[0.5], Directive[Brown, Thick, Dashed]}]


Showing the popup menu:
There are many cases to test, but I only tried a few.


ResourceFunction["CheckboxLegended"]. This is the most robust solution given that Daniel W's second answer doesn't work for me (12.1.1 for Linux x86 (64-bit) (June 19, 2020)) and Michael E2's answer is hard to change to functions other than Plot (at least, I couldn't figure it out for ListLinePlot). – Tanner Legvold Nov 17 '20 at 03:13