Taking Rahul's extension of Michael's answer a step further, using MeshShading instead of ColorFunction:
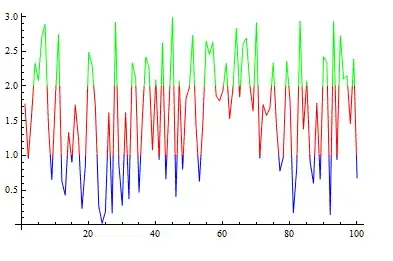
data = RandomReal[{0, 3}, 100];
ListLinePlot[data, MeshFunctions -> {#2 &}, Mesh -> {{1, 2}},
 MeshShading -> {Blue, Red, Green}, MeshStyle -> None]
Update: Although my preferred method is using MeshShading, you can also get a similar result using a combination of Interpolation, Plot and a piecewise ColorFunction as follows:
ClearAll[pwColorF];
pwColorF[thresholds : {___}, colors : {___} : ColorData[1, "ColorList"]][a_] :=
 Module[{tc = Transpose[{colors[[;; Length@thresholds]],
                         Function[{x, y}, x < a <= y] @@@
                         Partition[Join @@ {{-Infinity}, Most@thresholds, {Infinity}}, 2, 1]}]},
        Piecewise[tc]]

intF = Interpolation[data, InterpolationOrder -> 1];

Plot[Quiet@intF[x], {x, 0, 100}, PlotStyle -> Thick,
 ColorFunction -> (pwColorF[{1, 2, 3}, {Blue, Red, Green}][#2] &),
 ColorFunctionScaling -> False]


ColorFunctionis for smooth colours,MeshShadingis for flat colours. Right? – Sep 17 '14 at 23:17ColorFunctionassigns the colors to vertices of a single line with many vertices (i.e., it determinesVertexColors) with blending when the two vertices of a line segment have different colors, while withMeshShadingeach line segment gets its own color. without any blending – kglr Sep 17 '14 at 23:45