11

Kind of as an extension of this question: How to plot a series using different colors depending on the y-value

Is there something similar to MeshFunction or ColorFunction that can control whether a curve being plotted is dashed vs solid depending on the y-value?
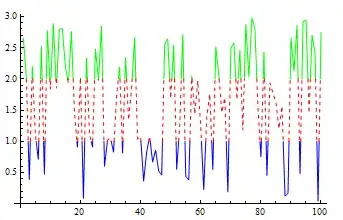
Hanmyo
  • 393
  • 2
  • 9

1 Answers1

13

A simple modification of the answer in the linked Q/A:

data = RandomReal[{0, 3}, 100];
ListLinePlot[data, MeshFunctions -> {#2 &}, Mesh -> {{1, 2}}, 
 MeshShading -> {Blue, Directive[Red, Dashed], Green}, MeshStyle -> None]

enter image description here

Use MeshShading -> {Dashing[.02], Dashing[None], Dotted} to get

enter image description here

kglr
  • 394,356
  • 18
  • 477
  • 896
  • Thanks so much for the fast answer! Just a quick question about how to apply it. If I want to dash when the absolute value is greater than 1, this code produces weird results. Any idea?

    data = RandomReal[{-3, 3}, 100]; ListLinePlot[data, MeshFunctions -> {Abs[#2] &}, Mesh -> {{1}}, MeshShading -> {Blue, Directive[Red, Dashed]}, MeshStyle -> None]

    – Hanmyo Feb 06 '15 at 08:45
  • @Hanmyo, i am getting the same "weird results" with Abs[#2]&. I don't know why; maybe a bug? Meanwhile, a work-around is to use ListLinePlot[data, MeshFunctions -> {#2 &}, Mesh -> {{-1, 1}}, MeshShading -> {Blue, Directive[Red, Dashed]}, MeshStyle -> None]. Btw, thank you for the accept. – kglr Feb 06 '15 at 13:27
  • Thanks for the response. I think I'll post it as a separate question, as I'm looking to do something more complicated involving Abs. – Hanmyo Feb 06 '15 at 20:34