11

If we'd like to display the $n$ roots of a polynomial on the complex plane as points, how can we do this? For example, if we have the equation $x^3 + x^2 + x + 1$, how can we plot the 3 roots as points in the complex plane?

There's more. We can suppose that we're given a range of the coefficients for an $n$th degree polynomial:

$$f(x) = c_0 x^0 + c_1 x^1 + c_2 x^2 + \dots + c_n x^n$$

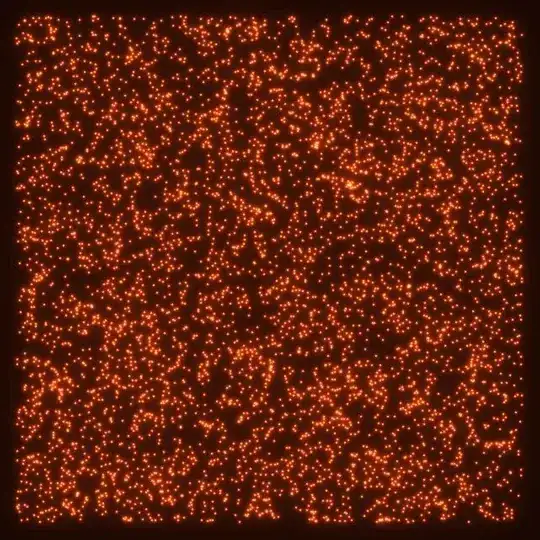
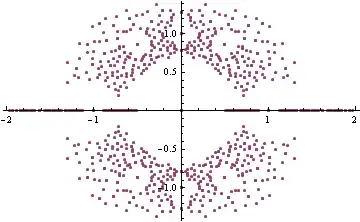
Here all $c_k$ values for $0 \le k \le n$ range from $r \le c_k \le s,\, c_k \in \mathbb{Z}$. I'd like to plot all possible roots for all possible polynomials on the same graph, given these constraints. In other words, we're given the parameters $n$, $r$, and $s$. I'd like to plot all possible roots of the polynomials that meet these conditions on the same plot.

One more thing, and this is probably the most important. I'm wondering if we can use a color scheme for the plot. For example, we can use a gray scale, indicating the number of times a root appears. If the same root appears often (i.e. $x=1$), then the root appears dark on the plot. If the same root only appears once, then it should be barely visible. CAN WE DO THIS?

NOTE

I don't want to plot the polynomials -- I just want to plot their roots. I want to make the roots darker the more times they appear, and lighter if they don't appear often.

J. M.'s missing motivation
  • 124,525
  • 11
  • 401
  • 574
Matt Groff
  • 1,141
  • 1
  • 10
  • 15
  • This question may be helpful: http://mathematica.stackexchange.com/questions/25122/the-plot-of-roots-of-polynomials – Matt Groff Oct 13 '14 at 18:08
  • You can make rather spectacular plots of polynomial roots that look like this: https://www.flickr.com/photos/104348204@N05/11537579304/sizes/o/ This takes advantage of the speed of Image and Fast Fourier Transforms. – DumpsterDoofus Oct 13 '14 at 21:08

3 Answers3

22

You can make plots sort of like this:

enter image description here

Or this:

enter image description here

Or this:

enter image description here

...by taking advantage of Image and Fourier using the following code. The plots will have a brightness proportional to the multiplicity of the root, and you can change the colors, convolution properties, etc., although it doesn't provide axes (you'll have to figure that out yourself).

SetSystemOptions[
  "SparseArrayOptions" -> {"TreatRepeatedEntries" -> 1}];
\[Gamma] = 0.12;
\[Beta] = 1.0;
fLor = Compile[{{x, _Integer}, {y, _Integer}}, (\[Gamma]/(\[Gamma] + 
        x^2 + y^2))^\[Beta], RuntimeAttributes -> {Listable}, 
   CompilationTarget -> "C"];
<< Developer`
$PlotComplexPoints[list_, magnification_, paddingX_, paddingY_, 
  brightness_] := 
 Module[{RePos = 
    paddingX + 1 + Round[magnification (# - Min[#])] &[Re[list]], 
   ImPos = paddingY + 1 + Round[magnification (# - Min[#])] &[
     Im[list]], sparse, lor, dimX, dimY}, dimX = paddingX + Max[RePos];
  dimY = paddingY + Max[ImPos];
  Image[(brightness Sqrt[dimX dimY] Abs[
       InverseFourier[
        Fourier[SparseArray[
           Thread[{ImPos, RePos}\[Transpose] -> 
             ConstantArray[1, Length[list]]], {dimY, dimX}]] Fourier[
          RotateRight[
           fLor[#[[All, All, 1]], #[[All, All, 2]]] &@
            Outer[List, Range[-Floor[dimY/2], Floor[(dimY - 1)/2]], 
             Range[-Floor[dimX/2], Floor[(dimX - 1)/2]]], {Floor[
             dimY/2], 
            Floor[dimX/2]}]]]])\[TensorProduct]ToPackedArray[{1.0, 
      0.3, 0.1}], Magnification -> 1]]

You can test it out on a list of 5000 random complex numbers like this:

$PlotComplexPoints[RandomComplex[{-1 - I, 1 + I}, 5000], 300, 20, 20, 10]

which produces this (actual image quality will be slightly better):

enter image description here

Or for a more interesting example, here's a plot of the roots of a random 150-degree polynomial:

expr = Evaluate@Sum[RandomInteger[{1, 10}] #^k, {k, 150}] &;
list = Table[N@Root[expr, k], {k, 150}];
$PlotComplexPoints[list, 320, 20, 20, 140]

enter image description here

which serves to illustrate this MathOverflow question.

DumpsterDoofus
  • 11,857
  • 1
  • 29
  • 49
  • Yes, that MO question was what got me thinking about the roots. I must say, very very mesmerizing displays. I've been wondering if I could possibly learn something by examining very very simple plots of polynomial roots, and slowly increasing the complexity. There is very obviously structure here with a kind of fractal quality. My hope was to attempt to find rules to this structure. I was unsure of whether or not to include this in the question, because I thought it would be off-topic. Anyways, Image and Fourier definitely seem to help with the processing, and I will study this a lot! – Matt Groff Oct 13 '14 at 23:37
  • @MattGroff: I don't really know much about polynomials, so unfortunately I can't really help with finding the structures you're looking for. There is definitely some sort of structure to polynomial roots with integer coefficients, see for example my photo of the cubics with lead coefficient 1 or 5 at http://www.flickr.com/photos/104348204@N05/11577728955/sizes/o/ and John Baez's in-depth work on polynomial roots and the Christensen sets. – DumpsterDoofus Oct 14 '14 at 00:30
  • I should have been thinking more along fractal lines to begin with. The photos were interesting, and John Baez's pages are amazing, so thanks a lot! Anyways, I guess I had to try to reinvent the wheel to get here. I haven't come across much in the way of deducing more complicated polynomials from simpler ones, and that was what I was thinking of. We can, of course, have a formula for the polynomials from cubics and quartics, but not quintics always. So I'm wondering if it's possible to deduce more information on quintics. I wish I knew more so I could share with you! – Matt Groff Oct 14 '14 at 01:27
  • I would love to see complete code to generate the first image in your post. Is it possible for you to share this? – Mr.Wizard Oct 23 '14 at 07:42
  • 1
    @Mr.Wizard: Sure, the pictures are not polynomial roots, but rather it was a by-product of an attempt to reproduce the visual effects seen in a fascinating optical toy built by an otherwise inane YouTube conspiracy theorist named Ben Palmer; a video of the object (along with the initial 60 seconds of Walter Russell sketches, which can be skipped) can be seen here. A link to code for the first picture is here and... – DumpsterDoofus Oct 23 '14 at 14:04
  • @Mr.Wizard: a link to the code to make the second picture is here. – DumpsterDoofus Oct 23 '14 at 14:05
  • 1
    @DumpsterDoofus I think that is too fine not to have a post of its own. Take it away: (64492) – Mr.Wizard Oct 30 '14 at 11:22
  • The roots of a random 150-degree polynomial with real coefficients would be symmetric about the real axis. I believe what you've plotted there is one root each of 150 random 150-degree polynomials. You could do something like expr = With[{coeffs = RandomInteger[{1, 10}, 150]}, Sum[coeffs[[k]] #^k, {k, 150}] &]; instead to get the correct plot. –  Oct 30 '14 at 11:50
  • @RahulNarain: Yup, you're right, good catch. I fixed it by adding an Evaluate to the definition of expression. – DumpsterDoofus Oct 30 '14 at 13:17
  • I suppose it's only somewhat related, but have you seen Kalantari's polynomiography, by any chance? – J. M.'s missing motivation May 23 '15 at 09:33
10

My try is the following that is made just NSolve and ListPlot with the Opacity option

eq[n_, r_, s_] := RandomInteger[{r, s}, {n}].Array[Power[x, # - 1] &, n]
sol[n_, r_,s_] := {Re[#], Im[#]} & /@ (x /. NSolve[eq[n, r, s] == 0, x])

ListPlot[sol[400, 1, 6],
 PlotRange -> {{-1.5, 1.5}, {-1.5, 1.5}},
 AspectRatio -> Automatic,
 PlotStyle -> {PointSize[Medium], Opacity[0.2], Black}]

Blockquote

Junho Lee
  • 5,155
  • 1
  • 15
  • 33
7

Just to get you started:

rs[n_, r_, s_] := Module[{f, t},
                         f[x_] := Tr@Array[c[#] x^# &, n + 1, 0];
                         t = Thread /@ (Array[c, n + 1, 0] -> # & /@ Tuples[Range[r, s], {n + 1}]);
                         Quiet[(x /. Solve[f[x] == 0, x]) /. t // N]
                  ]

ListPlot[Flatten[rs[5, -1, 1]] /. x_Real :> {x, 0} /. Complex[x_, y_] :> Chop@{x, y}]

Mathematica graphics

Dr. belisarius
  • 115,881
  • 13
  • 203
  • 453
  • Thanks, Belisarius! I figured that we'd have to use something like your $rs$ Module to group points together in order to add a grayscale effect later. I'll be studying up on the functions that you used. – Matt Groff Oct 13 '14 at 20:05
  • 1
    @MattGroff This may help you with the opacity (it isn't trivial) http://mathematica.stackexchange.com/a/9191/193 – Dr. belisarius Oct 13 '14 at 20:25