Bug introduced in 7.0.1 or earlier and persisting through 11.0.1 or later
While I've been thinking about this question, I tried to visualize the Intercepts. I use three snippets, actually snippet 1, 2 and 3. The visualization works as expected.
p[x_] := x^4 - 4 x^2 - 2 x + 1

solutions = NSolve[p[x] == 0, x]

snippet1 =
  Plot[p[x], {x, -3, 3}, PlotStyle -> Green,
   MeshFunctions -> {p[x] /. x -> # &}, Mesh -> {{0}},
   MeshStyle -> Directive[PointSize[Large], Red],
   PlotLabel -> "Snippet 1"];

snippet2 =
  Show[Plot[p[x], {x, -3, 3}, PlotStyle -> Brown],
   Graphics[{Red, PointSize[Large], Point[{x, p[x]} /. solutions]}],
   PlotLabel -> "Snippet 2"];

snippet3 =
  Plot[p[x], {x, -3, 3}, PlotStyle -> Blue,
   Epilog -> {PointSize[Large], Red, Point[{x, 0} /. NSolve[p[x]]]},
   PlotLabel -> "Snippet 3"];

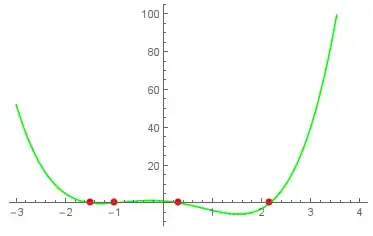
When applying snippet 1 with a larger xmin-value a fifth red spot appears. I do not observe this behavior on snippet 2 and 3. What's wrong with snippet 1, or with my knowledge/interpretation?
snippet1 =
 Plot[p[x], {x, -3, 4}, PlotStyle -> Green,
  MeshFunctions -> {p[x] /. x -> # &}, Mesh -> {{0}},
  MeshStyle -> Directive[PointSize[Large], Red],
  PlotLabel -> "Snippet 1"]

I'm on 10.0 for Mac OS X x86 (64-bit) (September 10, 2014).

PlotRange -> All. – Michael E2 Oct 15 '14 at 03:28