I'm trying to plot two recursive functions (p and θ) on a map. So far I have:
θ0 = Pi/2;
p0 = 0;
α = 0.1;
β = 1;

θ[j_] := θ[j] = θ[j - 1] + β*p[j - 1];
p[j_] := p[j] =
   p[j - 1] - α*Sin[θ[j - 1] + β*p[j - 1]];
θ[0] = θ0;
p[0] = p0;
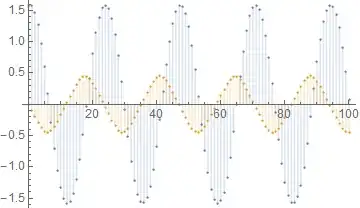
How can I plot p[j] against θ[j] for 0 <= j <= 100?

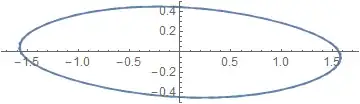
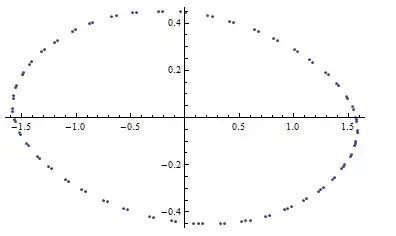
pon one axis andθon the other? – Mr.Wizard Oct 18 '14 at 22:41Tableusing e.g.CasesorSelect. Let me know if you need help. – Mr.Wizard Oct 18 '14 at 22:50