My defined function next find {nextpoint, nextdirection} value from {startpoint, startdirection} using NSolve.
next[{sp_, sd_}][δ_] := Module[{φ, sol, fp, fd},
  sol = NSolve[{{x[φ, δ], y[φ, δ]} ==
      sp + t sd, Abs[t] > 10^(-9), 0 <= φ < 2 π}, {t, φ}, Reals]// Quiet;
  sol = If[Length[sol] > 0, sol[[1]]];
  fp = {x[φ, δ], y[φ, δ]} /. sol;
  fd = rDirec[sd, (D[y[φ, δ], φ]/D[x[φ, δ], φ] /. sol)];
  {fp, fd}
]
and second function rDirec is to decide reflected direction that is transformed by the following diagram.

rDirec[d_, m_] := With[{sd = Normalize[N@d], θ = ArcTan[m]},
  RotationTransform[θ][ReflectionTransform[{0, 1}][
     RotationTransform[-θ][sd]]] // Normalize
]
This is your function for drawing.
x[φ_, δ_] := Sin[φ] + δ/2 Sin[φ] + δ/6 Sin[3φ];
y[φ_, δ_] := -Cos[φ] + δ/2 Cos[φ] - δ/6 Cos[3φ];
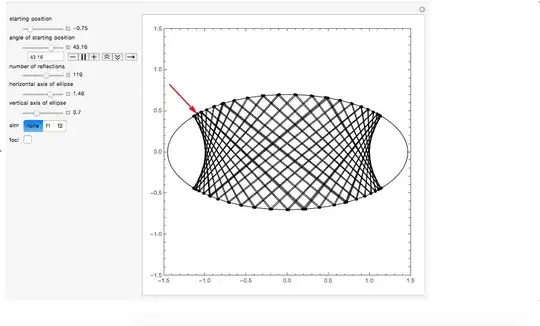
now you can use these next and rDirec for reflecting process of any parametric functions like this.
Manipulate[
 list = NestList[next[#][δ] &, {{x[s, δ], y[s, δ]},{1, 1.7}},20]//Quiet;
 ParametricPlot[{x[φ, δ], y[φ, δ]}, {φ, 0, 4 π},
  Epilog -> {Blue,
    Arrow[{#[[1]], #[[1]] + Normalize[#[[2]]]/5}] & /@ list,
    Black, Line[Partition[Transpose[list][[1]], 3, 1]],
    Red,
    Arrow[{list[[1, 1]], list[[1, 1]] + Normalize[list[[1, 2]]]/5}]}],
 {{δ, 0.4}, 0.1, 0.9}, {s, 0, π/4},
 ContinuousAction -> False,
 SaveDefinitions -> True
]

Version Update
list = {};
DynamicModule[{list,φ,p1, p2, bf = False, pf = False, df = 0.4, sf = 0},
 Manipulate[
  p1 = {x[φ, δ], y[φ, δ]};
  If[df != δ, list = {}; bf = False; pf = False]; df = δ;
  If[sf != φ, p2 = Through[{Cos, Sin}[φ + π/2]]/4]; sf = φ;
  If[! pf,
   Graphics[Locator[Dynamic[p1 + p2, (p2 = Normalize[# - p1]/4) &]],
    Prolog -> {Blue,
      If[list =!= {} && bf, {Opacity[0.2],
        Arrowheads[Small],
        Arrow[{#[[1]], #[[1]] + Normalize[#[[2]]]/4}] & /@ list,
        Black, Line[Partition[Transpose[list][[1]], 3, 1]],
        Red, Opacity[1], Arrowheads[Medium],
        Arrow[{list[[1, 1]],list[[1, 1]] + Normalize[list[[1, 2]]]/4}]}],
      Black,
      ParametricPlot[{x[θ,δ], y[θ,δ]}, {θ, 0, 4 π}][[1]],
      Orange, PointSize[Large], Point[p1], Thick,
      Dynamic@Arrow[{p1, p1 + p2}]
      }, Axes -> True, PlotRange -> {{-1.3, 1.3}, {-1, 1}},
    ImageSize -> 300],
   lines = Partition[Transpose[list][[1]], 3, 1];
   Animate[Graphics[{Opacity[0.2], Line@lines[[;;t]]},
     Epilog -> {
       Black,
       ParametricPlot[{x[θ,δ], y[θ,δ]}, {θ, 0, 4 π}][[1]],
       Orange, PointSize[Large], Point[p1], Thick,
       Dynamic@Arrow[{p1, p1 + p2}]
       }, Axes -> True, PlotRange -> {{-1.3, 1.3}, {-1, 1}},
     ImageSize -> 300], {t, 1, Length[lines], 1}, Paneled -> False,
    ControlPlacement -> Bottom]
   ],
  Pane[Row[{
     Pane[Column[{
        Row[{Button[" Run ", bf = True; pf = False;
           list = NestList[next[#][δ] &, {{x[φ,δ], y[φ,δ]}, p2}, 10]],
          Dynamic@Button[If[! pf, " Play ", " Back "], pf = ! pf,
            Enabled -> bf,
            Background -> If[! pf, Automatic, Orange]]}],
        Row[Button["+" <> ToString@#,
            list = Join[list, NestList[next[#][δ] &,
               If[list === {},
                If[bf, {{x[φ,δ], y[φ,δ]}, p2}],
                Last[list]], #]], Enabled -> Dynamic@bf] & /@ {5, 10, 20}]}
       ], ImageMargins -> {{0, 20}, {0, 0}}],
     Pane[Column[{
        Control@{{δ, 0.4}, 0.1, 0.9},
        Control[{{φ,π/4}, 0, 2 π}]}]]}]],
  ContinuousAction -> True,
  SaveDefinitions -> True]]
Example

or